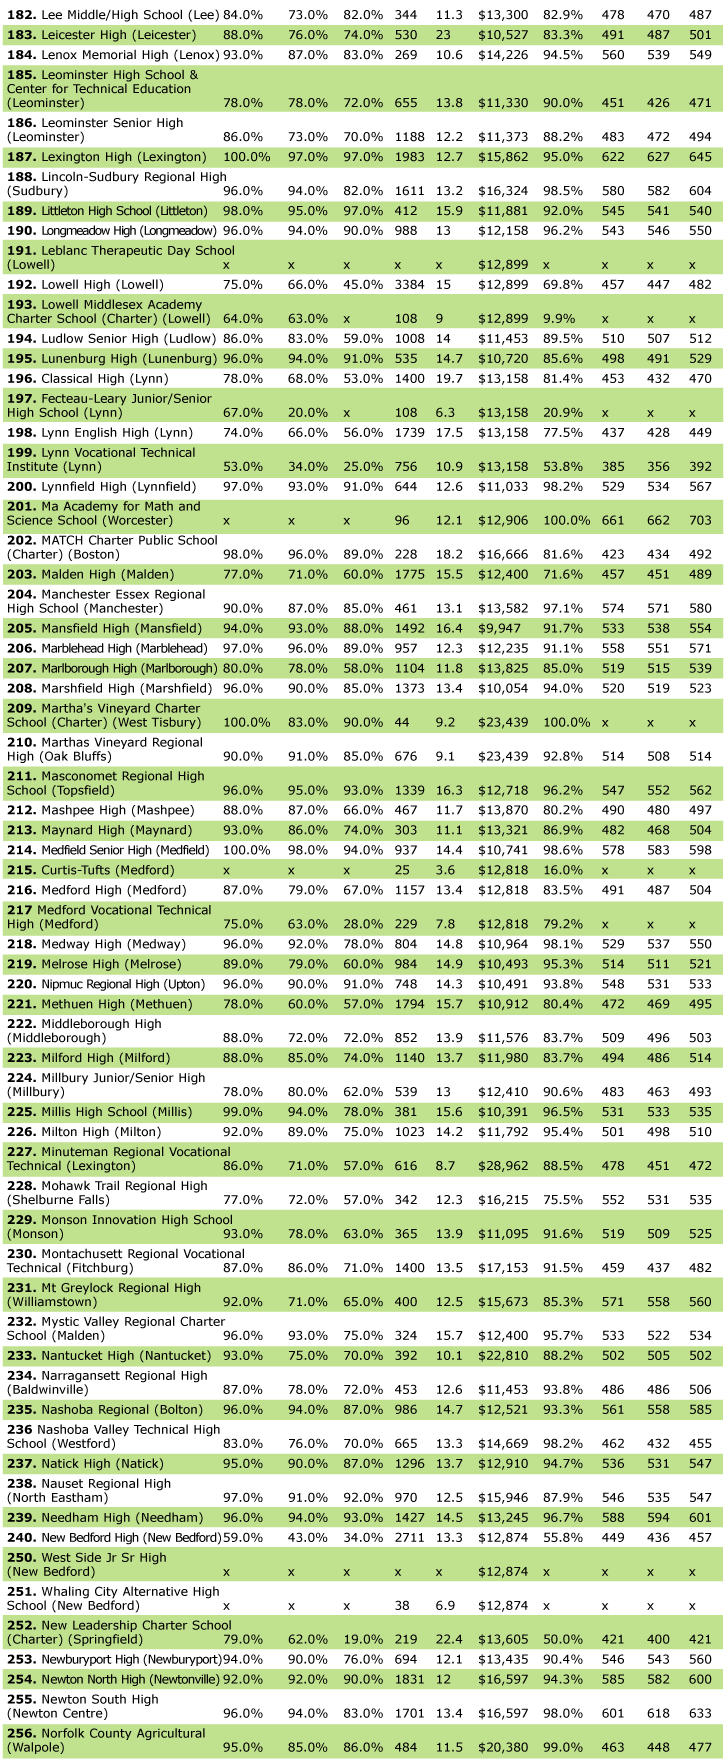
MA’s Top High Schools 2012: The Breakdown of 1 to 392 Individual Scores
Tuesday, February 21, 2012
GoLocalWorcester has the answers. By applying mathematical rigor to the question, and after months of research, hundreds of hours of spreadsheet toil, and careful statistical analysis, we've got this year's rankings. We will reveal the entire list at the end of the week.
In order to come up with a realistic ranking system, we gathered thousands of data points from publicly available resources in five specific areas. Included were MCAS proficiency scores, SAT scores, student to teacher ratios, spending per student, and total school enrollment. These individual areas were then broken down and analyzed statistically, employing methodolgy used in similar rankings created elsewhere in New England.
The weightings for calculations were as follows:
Student/Teacher Ratio 15%, Per Pupil Spending 15%, MCAS-English 10%, MCAS-Math 10%, MCAS-Science 10%, SAT-Verbal 10%, SAT-Math 10%, SAT-Writing 10%, Graduation Rate 10%
Each school’s weighted numbers were added into a single evaluative number, which, when ordered from highest to lowest, gave us our ranking.


Related Articles
- Central MA’s #5 School: Algonquin Regional High School
- Central MA’s #13 School: Hopedale Jr. Sr. High
- Central MA’s Top High Schools 2012: How We Got the Rankings
- Central MA’s #6 School: Nashoba Regional High
- Central MA’s #14 School: Blackstone Valley Regional Vocational Technical
- MA’s Top High Schools 2012: The Link Between Schools and Home Values
- Central MA’s #7 School: Advanced Math and Science Academy Charter School
- Central MA’s #15 School: Sutton High School
- MA’s Top High Schools 2012: The Complete List of 1 to 392
- Central MA’s #8 School: Tahanto Regional High School
- Central MA’s #16 School: Tantasqua Regional High School
- Central MA’s #1 School: Mass Academy for Math and Science School
- Central MA’s #9 School: Shrewsbury Sr. High School
- Central MA’s #17 School: Wachusett Regional High School
- Central MA’s #2 School: The Bromfield School
- Central MA’s #10 School: Oakmont Regional High School
- Central MA’s #18 School: North Middlesex Regional High School
- Central MA’s #3 School: Westborough High School
- Central MA’s #11 School: Nipmuc Regional High School
- Central MA’s #19 School: Lunenburg High School
- Central MA’s #4 School: Hopkinton High School
- Central MA’s #12 School: Grafton High School
- Central MA’s #20 School: West Boylston Jr. Sr. High


 Delivered Free Every
Follow us on Pinterest Google + Facebook Twitter See It Read It