‘Stop the Violence’ Fashion and Talent Show at Doherty High


 Email to a friend
Permalink
Email to a friend
Permalink
Wednesday, January 07, 2015
Patrick Sargent, GoLocal Worcester Contributor
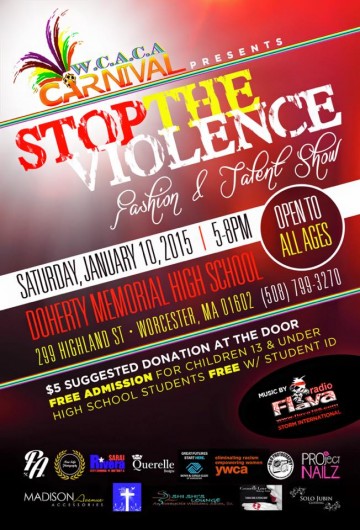
On Saturday, the Worcester Caribbean American Carnival Association (
WCACA) is hosting the 'Stop the Violence' Fashion and Talent Show at Doherty Memorial High School in Worcester.
The event is open to all ages and will "showcase in opposition of the recent surge in acts of violence resulting in early death for many of our youth, teen, and young adults in Worcester."
"We are expecting a mixed audience of about 150 to 200 people of all age groups. We have been marketing it as a family event and expect families to attend together. We need to start early with violence prevention activities," said Jennifer Gaskin, President of WCACA.
City Councilor Sarai Rivera will open the event with remarks and will be followed by several anti-violence speakers. The event will be filled with artists, dance groups, singers and fashion designers.
Food vendors will be on site and several raffles will be held. WCACA will also be handing out "swag bags with information about anti-violence programs and souvenirs.
The show runs from 5 p.m. to 8 p.m. and there is a suggested $5 donation at the door for admission. Free admission for children 13 and under and high school students with student ID. WCACA is a registered non profit 501(c)3 organization. Proceeds will go to covering venue costs and then will be used to fund WCACA community initiatives with local community agencies like the Boys & Girls Club, YMCA, and Abby's House to develop mentoring and outreach programs.
Music will be provided by Radio Flava.
Related Slideshow: The 50 Least Diverse High Schools in Massachusetts
Prev
Next
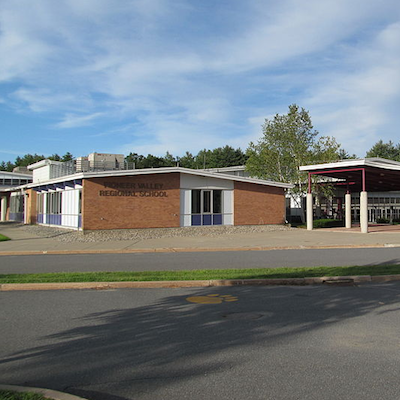
#50 Pioneer Valley Reg.
Northfield, MA
Total enrollment: 500
Percentage of total enrollment
Amer Indian/Alaskan: 0.9%
Asian/Pacific Islander: 1.6%
Black: 1.0%
Hispanic: 2.4%
Two or more races: 1.0%
White: 93.2%

Prev
Next
#49 Health & Human Svc.
Health & Human Svc. HS, Lawrence, MA
Total enrollment: 520
Percentage of total enrollment
Amer Indian/Alaskan: 0.0%
Asian/Pacific Islander: 0.6%
Black: 2.5%
Hispanic: 93.3%
Two or more races: 0.2%
White: 3.5%

Prev
Next
#48 South Shore HS
South Shore Voc. Tech. HS, Hanover, MA
Total enrollment: 600
Percentage of total enrollment
Amer Indian/Alaskan: 0.0%
Asian/Pacific Islander: 0.0%
Black: 2.8%
Hispanic: 2.7%
Two or more races: 1.2%
White: 93.3%

Prev
Next
#47 Seekonk HS
Seekonk, MA
Total enrollment: 628
Percentage of total enrollment
Amer Indian/Alaskan: 0.0%
Asian/Pacific Islander: 2.7%
Black: 0.8%
Hispanic: 2.4%
Two or more races: 0.8%
White: 93.3%

Prev
Next
#46 Athol HS
Athol, MA
Total enrollment: 378
Percentage of total enrollment
Amer Indian/Alaskan: 0.0%
Asian/Pacific Islander: 0.0%
Black: 1.9%
Hispanic: 2.9%
Two or more races: 1.9%
White: 93.4%

Prev
Next
#45 Humanities & Leadership
Humanities & Leadership Dev. HS, Lawrence, MA
Total enrollment: 521
Percentage of total enrollment
Amer Indian/Alaskan: 0.0%
Asian/Pacific Islander: 1.7%
Black: 1.9%
Hispanic: 93.5%
Two or more races: 0.0%
White: 2.9%

Prev
Next
#44 Blackstone Valley
Blackstone Valley Reg. Voc. Tech., Upton, MA
Total enrollment: 1,164
Percentage of total enrollment
Amer Indian/Alaskan: 0.0%
Asian/Pacific Islander: 0.8%
Black: 0.8%
Hispanic: 2.8%
Two or more races: 2.1%
White: 93.5%

Prev
Next
#43 Hopedale Jr. Sr. HS
Hopedale, MA
Total enrollment: 548
Percentage of total enrollment
Amer Indian/Alaskan: 0.5%
Asian/Pacific Islander: 1.6%
Black: 0.5%
Hispanic: 2.6%
Two or more races: 1.1%
White: 93.6%

Prev
Next
#42 Wahconah Reg. HS
Dalton, MA
Total enrollment: 563
Percentage of total enrollment
Amer Indian/Alaskan: 0.0%
Asian/Pacific Islander: 0.7%
Black: 0.9%
Hispanic: 2.0%
Two or more races: 2.7%
White: 93.8%

Prev
Next
#41 W. Wareham Academy
Wareham, MA
Total enrollment: 16
Percentage of total enrollment
Amer Indian/Alaskan: 0.0%
Asian/Pacific Islander: 0.0%
Black: 0.0%
Hispanic: 0.0%
Two or more races: 6.2%
White: 93.8%

Prev
Next
#40 Sutton HS
Sutton, MA
Total enrollment: 418
Percentage of total enrollment
Amer Indian/Alaskan: 0.0%
Asian/Pacific Islander: 0.2%
Black: 0.5%
Hispanic: 1.7%
Two or more races: 3.8%
White: 93.8%

Prev
Next
#39 Bay Path HS
Bay Path Reg. Voc. Tech. HS, Charlton, MA
Total enrollment: 1,104
Percentage of total enrollment
Amer Indian/Alaskan: 0.1%
Asian/Pacific Islander: 0.5%
Black: 0.4%
Hispanic: 4.9%
Two or more races: 0.3%
White: 93.9%

Prev
Next
#38 HS Learning Center
Lawrence, MA
Total enrollment: 167
Percentage of total enrollment
Amer Indian/Alaskan: 0.0%
Asian/Pacific Islander: 1.8%
Black: 1.8%
Hispanic: 94.0%
Two or more races: 0.0%
White: 2.4%

Prev
Next
#37 Shawsheen Valley
Shawsheen Valley Vocational Tech., Billerica, MA
Total enrollment: 1,372
Percentage of total enrollment
Amer Indian/Alaskan: 0.2%
Asian/Pacific Islander: 0.4%
Black: 0.8%
Hispanic: 3.0%
Two or more races: 1.5%
White: 94.1%

Prev
Next
#36 Nipmuc Reg. HS
Upton, MA
Total enrollment: 667
Percentage of total enrollment
Amer Indian/Alaskan: 0.1%
Asian/Pacific Islander: 1.4%
Black: 1.2%
Hispanic: 2.4%
Two or more races: 0.7%
White: 94.0%

Prev
Next
#35 Tewksbury Memorial HS
Tewksbury, MA
Total enrollment: 985
Percentage of total enrollment
Amer Indian/Alaskan: 0.1%
Asian/Pacific Islander: 2.6%
Black: 1.3%
Hispanic: 1.8%
Two or more races: 0.0%
White: 94.1%

Prev
Next
#34 N. Reading HS
North Reading, MA
Total enrollment: 755
Percentage of total enrollment
Amer Indian/Alaskan: 0.0%
Asian/Pacific Islander: 1.9%
Black: 0.5%
Hispanic: 2.0%
Two or more races: 1.5%
White: 94.2%

Prev
Next
#33 Joseph Case HS
Swansea, MA
Total enrollment: 551
Percentage of total enrollment
Amer Indian/Alaskan: 0.2%
Asian/Pacific Islander: 0.9%
Black: 2.0%
Hispanic: 0.9%
Two or more races: 1.6%
White: 94.4%

Prev
Next
#32 Gardner Academy
Gardner Academy for Learning and Tech., Gardner, MA
Total enrollment: 91
Percentage of total enrollment
Amer Indian/Alaskan: 0.0%
Asian/Pacific Islander: 1.1%
Black: 0.0%
Hispanic: 2.2%
Two or more races: 2.2%
White: 94.5%
Prev
Next
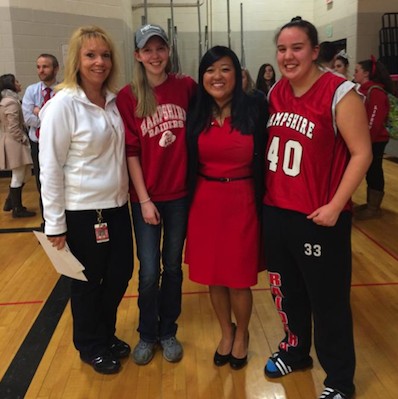
#31 Hampshire Reg. HS
Westhampton, MA
Total enrollment: 756
Percentage of total enrollment
Amer Indian/Alaskan: 0.0%
Asian/Pacific Islander: 0.4%
Black: 0.5%
Hispanic: 2.8%
Two or more races: 1.6%
White: 94.7%

Prev
Next
#30 Triton Reg. HS
Byfield, MA
Total enrollment: 738
Percentage of total enrollment
Amer Indian/Alaskan: 0.0%
Asian/Pacific Islander: 1.2%
Black: 0.5%
Hispanic: 2.7%
Two or more races: 0.8%
White: 94.7%

Prev
Next
#29 Medway HS
Medway, MA
Total enrollment: 779
Percentage of total enrollment
Amer Indian/Alaskan: 0.3%
Asian/Pacific Islander: 1.9%
Black: 0.5%
Hispanic: 1.9%
Two or more races: 0.6%
White: 94.7%

Prev
Next
#28 Apponequet Reg. HS
Lakeville, MA
Total enrollment: 813
Percentage of total enrollment
Amer Indian/Alaskan: 0.2%
Asian/Pacific Islander: 1.1%
Black: 0.6%
Hispanic: 1.5%
Two or more races: 1.8%
White: 94.7%

Prev
Next
#27 Pentucket HS
Pentucket Regional Sen. HS, West Newbury, MA
Total enrollment: 785
Percentage of total enrollment
Amer Indian/Alaskan: 0.0%
Asian/Pacific Islander: 1.4%
Black: 0.4%
Hispanic: 1.9%
Two or more races: 1.5%
White: 94.8%

Prev
Next
#26 Gateway Reg. HS
Huntington, MA
Total enrollment: 282
Percentage of total enrollment
Amer Indian/Alaskan: 0.0%
Asian/Pacific Islander: 0.7%
Black: 0.4%
Hispanic: 2.8%
Two or more races: 1.1%
White: 95.0%

Prev
Next
#25 N. Middlesex Reg. HS
Townsend, MA
Total enrollment: 956
Percentage of total enrollment
Amer Indian/Alaskan: 0.1%
Asian/Pacific Islander: 1.5%
Black: 0.8%
Hispanic: 1.7%
Two or more races: 0.8%
White: 95.1%

Prev
Next
#24 Scituate HS
Scituate, MA
Total enrollment: 947
Percentage of total enrollment
Amer Indian/Alaskan: 0.0%
Asian/Pacific Islander: 0.9%
Black: 2.2%
Hispanic: 0.4%
Two or more races: 1.3%
White: 95.1%
Prev
Next
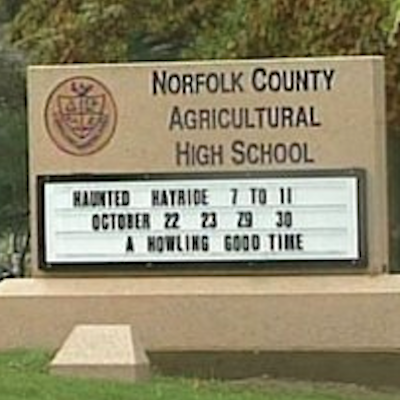
#23 Norfolk County HS
Norfolk County Agricultural HS, Walpole, MA
Total enrollment: 476
Percentage of total enrollment
Amer Indian/Alaskan: 0.0%
Asian/Pacific Islander: 1.1%
Black: 1.1%
Hispanic: 1.5%
Two or more races: 1.1%
White: 95.4%

Prev
Next
#22 Masconomet Reg. HS
Topsfield, MA
Total enrollment: 1,382
Percentage of total enrollment
Amer Indian/Alaskan: 0.1%
Asian/Pacific Islander: 2.2%
Black: 0.4%
Hispanic: 1.7%
Two or more races: 0.1%
White: 95.4%
Prev
Next
#21 King Phillip Reg. HS
Wrentham, MA
Total enrollment: 1,322
Percentage of total enrollment
Amer Indian/Alaskan: 0.3%
Asian/Pacific Islander: 1.1%
Black: 0.8%
Hispanic: 0.7%
Two or more races: 1.4%
White: 95.8%

Prev
Next
#20 Norwell HS
Norwell, MA
Total enrollment: 677
Percentage of total enrollment
Amer Indian/Alaskan: 1.2%
Asian/Pacific Islander: 0.4%
Black: 0.1%
Hispanic: 2.1%
Two or more races: 0.6%
White: 96.0%

Prev
Next
#19 Norton HS
Norton, MA
Total enrollment: 715
Percentage of total enrollment
Amer Indian/Alaskan: 0.0%
Asian/Pacific Islander: 1.6%
Black: 1.1%
Hispanic: 0.8%
Two or more races: 0.3%
White: 95.4%

Prev
Next
#18 Charles McCann
Charles McCann Voc. Tech., North Adams, MA
Total enrollment: 505
Percentage of total enrollment
Amer Indian/Alaskan: 0.0%
Asian/Pacific Islander: 0.4%
Black: 1.0%
Hispanic: 2.0%
Two or more races: 0.8%
White: 95.8%
Prev
Next
#17 Westfield Vocational
Westfield Vocational Tech. HS, Westfield, MA
Total enrollment: 470
Percentage of total enrollment
Amer Indian/Alaskan: 0.0%
Asian/Pacific Islander: 1.5%
Black: 1.5%
Hispanic: 0.6%
Two or more races: 0.4%
White: 96.0%

Prev
Next
#16 Medfield Senior High
Medfield, MA
Total enrollment: 882
Percentage of total enrollment
Amer Indian/Alaskan: 0.0%
Asian/Pacific Islander: 3.3%
Black: 0.3%
Hispanic: 1.6%
Two or more races: 1.5%
White: 93.3%

Prev
Next
#15 Georgetown MS/HS
Georgetown, MA
Total enrollment: 407
Percentage of total enrollment
Amer Indian/Alaskan: 0.0%
Asian/Pacific Islander: 1.0%
Black: 0.0%
Hispanic: 1.2%
Two or more races: 1.5%
White: 96.3%

Prev
Next
#14 Hanover HS
Hanover, MA
Total enrollment: 778
Percentage of total enrollment
Amer Indian/Alaskan: 0.0%
Asian/Pacific Islander: 1.2%
Black: 1.2%
Hispanic: 1.0%
Two or more races: 0.3%
White: 96.4%

Prev
Next
#13 Carver MS/HS
Carver, MA
Total enrollment: 870
Percentage of total enrollment
Amer Indian/Alaskan: 0.2%
Asian/Pacific Islander: 0.1%
Black: 2.3%
Hispanic: 0.3%
Two or more races: 0.7%
White: 96.3%

Prev
Next
#12 Duxbury HS
Duxbury, MA
Total enrollment: 1,037
Percentage of total enrollment
Amer Indian/Alaskan: 0.2%
Asian/Pacific Islander: 1.1%
Black: 0.3%
Hispanic: 0.8%
Two or more races: 1.2%
White: 96.5%

Prev
Next
#11 Westport HS
Westport, MA
Total enrollment: 381
Percentage of total enrollment
Amer Indian/Alaskan: 0.0%
Asian/Pacific Islander: 0.3%
Black: 0.5%
Hispanic: 2.4%
Two or more races: 0.0%
White: 96.9%

Prev
Next
#10 Pembroke HS
Pembroke, MA
Total enrollment: 984
Percentage of total enrollment
Amer Indian/Alaskan: 0.0%
Asian/Pacific Islander: 0.8%
Black: 1.2%
Hispanic: 1.0%
Two or more races: 0.1%
White: 96.8%

Prev
Next
#9 Marshfield HS
Marshfield, MA
Total enrollment: 1,304
Percentage of total enrollment
Amer Indian/Alaskan: 0.1%
Asian/Pacific Islander: 0.6%
Black: 0.2%
Hispanic: 1.8%
Two or more races: 0.5%
White: 96.9%

Prev
Next
#8 Franklin County Tech.
Turners Falls, MA
Total enrollment: 523
Percentage of total enrollment
Amer Indian/Alaskan: 0.2%
Asian/Pacific Islander: 0.6%
Black: 0.0%
Hispanic: 1.0%
Two or more races: 1.3%
White: 96.9%

Prev
Next
#7 Sandwich HS
Sandwich, MA
Total enrollment: 786
Percentage of total enrollment
Amer Indian/Alaskan: 0.1%
Asian/Pacific Islander: 1.8%
Black: 1.1%
Hispanic: 0.0%
Two or more races: 0.0%
White: 96.9%
Prev
Next
#6 Silver Lake Reg. HS
Kingston, MA
Total enrollment: 1,274
Percentage of total enrollment
Amer Indian/Alaskan: 0.1%
Asian/Pacific Islander: 0.7%
Black: 1.5%
Hispanic: 0.2%
Two or more races: 0.2%
White: 97.4%

Prev
Next
#5 Douglas HS
Douglas, MA
Total enrollment: 573
Percentage of total enrollment
Amer Indian/Alaskan: 0.0%
Asian/Pacific Islander: 0.5%
Black: 0.0%
Hispanic: 1.6%
Two or more races: 0.5%
White: 97.4%
Prev
Next
#4 Old Colony Vocational
Old Colony Reg. Vocational Tech., Rochester, MA
Total enrollment: 579
Percentage of total enrollment
Amer Indian/Alaskan: 0.0%
Asian/Pacific Islander: 0.0%
Black: 0.3%
Hispanic: 0.5%
Two or more races: 1.0%
White: 98.1%

Prev
Next
#3 International HS
Lawrence, MA
Total enrollment: 521
Percentage of total enrollment
Amer Indian/Alaskan: 0.0%
Asian/Pacific Islander: 0.6%
Black: 0.2%
Hispanic: 98.5%
Two or more races: 0.0%
White: 0.8%
Prev
Next
#2 Tahanto Regional HS
Boylston, MA
Total enrollment: 542
Percentage of total enrollment
Amer Indian/Alaskan: 0.0%
Asian/Pacific Islander: 0.2%
Black: 0.6%
Hispanic: 0.0%
Two or more races: 0.2%
White: 99.1%

Prev
Next
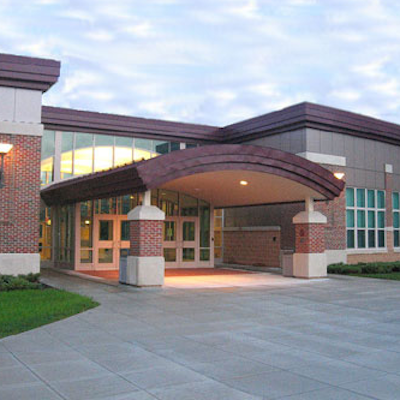
#1 Manchester Essex HS
Manchester Essex Regional HS, Manchester, MA
Total enrollment: 461
Percentage of total enrollment
Amer Indian/Alaskan: 0.0%
Asian/Pacific Islander: 0.0%
Black: 0.4%
Hispanic: 0.0%
Two or more races: 0.2%
White: 99.3%
Related Articles
Enjoy this post? Share it with others.
Email to a friend
Permalink


Follow us on Pinterest Google + Facebook Twitter See It Read It