Are Latino Students in Worcester at an Educational Disadvantage?


 Email to a friend
Permalink
Email to a friend
Permalink
Monday, April 07, 2014
Nicholas Handy, GoLocalWorcester Contributor
Massachusetts ranks 28th out of 47 states in terms of how well their Latino children are reaching key milestones in childhood development, according to a recently published Annie E. Casey Foundation report entitled
Race for Results: Building a Path to Opportunity for All Children.
The report analyzed 12 key areas of a child’s development from birth to graduation among the five main demographics of the nation’s population and then ranked each state with a standardized score from 0 to 1000. The higher the state’s score, the better they are preparing their children.
Comparatively, Massachusetts ranked 1st in the white demographic, 5th in the African American demographic, and 9th in the Asian and Pacific Island demographic. They were unranked in the American Indian demographic due to lack of population.
The Latino population in Massachusetts may be struggling to reach key developmental milestones, but educators in the Worcester Public School District point to a variety of issues that Latino children face in regards to their education.
Language Barriers
The Worcester Public School District is one of the school districts in Massachusetts with a majority Latino population. Of the school districts 24,562 children enrolled for the 2013-2014 school year, 38-percent are Latino. The state average for Latinos currently enrolled in school is 17-percent.
One of the largest issues facing educators and the community with Latino children and families is that many have recently immigrated to the country, making language a barrier for learning. On average, it takes someone five years to become proficient in a language.
“A large percentage of my students are Latino and a significant number of them come to the school with English being a second language,” said Maureen Binienda, principal of South High Community School in Worcester. “Each student comes in with their own level of competency of the English language. One of the biggest issues that those children have is acquisition of the language while also having to learn in the classroom.”
Latino children whose families have recently immigrated to the United States typically face trouble with language acquisition for many reasons. While they may be learning in the classroom in English, oftentimes a home setting will feature the language of their family’s native country.
Parents of immigrant families usually have little to no knowledge of the English language, making it much more difficult for them to help their children with homework or school activities. Parents may also be out of the loop with their child and their education because they may be forced to take a job with strange hours or multiple jobs to support the family.
“We have a lot of Latino families who are just coming here and getting established,” said Tracey O’Connell Novick, a member of the Worcester School Committee. “We are working with the community and working with parents to show them what strengthens the children’s ability to do well in school.”
Many schools throughout the nation offer English Language Learners (ELL) and English as a Second Language (ESL) programs to aid Latinos in their transition from their native language to English. Although these programs help many Latinos, they are not without their problems.
“The academic rigor is increasing,” said Hilda Ramirez, assistant director of the Latino Education Institute. “The ELL and ESL programs – while great for the students who are not as familiar with the English language – lack some of the rigor that a traditional classroom may have.”
Other Issues
While language is the largest barrier facing Worcester’s Latino population, there are other barriers in place that hinder a Latino child’s ability to learn.
Many top educators in the district point to a lack of full day preschool programs as another hindrance on the Latino population’s youth. With early learning being such a crucial part of a child’s development, missing out on preschool or only attending a half-day program may not give the child the proper head-start that it needs.
“I wish that we had full funding for preschool programs,” said John Monfredo, a member of the Worcester School Committee. “We need to reach students and their parents at an early age. We have some children going into kindergarten that lack proper word recognition.”
Disciplinary issues are also a problem in the Latino community. Latinos in the Worcester Public School District have some of the highest suspension, absenteeism, and dropout rates of all demographic groups.

Absenteeism is one issue facing the Latino community in Worcester
“There is a high level of suspension among Latinos in the district,” said Ramirez. “Most of these suspensions are associated with compliance issues, but it is a very complex issue. We have a report pointing to a lot of suspension in kindergarten and first grade, which is kind of difficult to look at. At that point it clearly isn’t related to a power struggle.”
Ramirez also noted that diversity in the teaching core is an issue. While the Worcester Public School District is among the most diverse in the state, their teachers are lacking in diversity.
“We have a report that shows that the diversity among children is high but the diversity among teachers is not,” said Ramirez. “But this is a national struggle, not just an issue facing Worcester.”
Helpful Programs
The Worcester School District, while committed to helping all children within the district, has created a variety of programs and initiatives designed to help Latino children through their education.
Some schools in the district provide dual language programs as early as kindergarten in which students are taught literacy and content in two languages.
“We have been working with a dual language program that examines child development,” said Novick. “Programs like these are interesting because children begin to improve over time. The children who are acquiring English are doing better in the long term because from a young age they understand the language.”
At South High Community School, where 39.2-percent of students are Latino, Principal Maureen Binienda has worked to bring programs into place that aid the majority demographic of her school.
“We started a mentoring program linking Latino students with successful Latinos in the community so that students have an opportunity to have role models,” said Binienda. “We have noticed a lot of improvements and have seen an increased number of Latino students in advanced placement classes.”
Absenteeism is one issue facing the Latino community in Worcester
South High Community School also offers tutoring programs that meet on Tuesdays and Thursdays with buses that run late to bring the students home. They also work with families to provide a quality education for the students by translating documents that have to be sent home into one of seven languages that are spoken at the school.
Reaching out to high school students is an important step in creating a culture that makes students want to go on to secondary education, but others in the Worcester Public School District are looking at younger age groups to spark an interest in education.
“I know there are programs that take children as young as six months and work with their families to show them the importance of nutrition,” said Monfredo. “I know these programs are out there, but only in small numbers. We don’t do enough with prevention; that is my biggest complaint as an educator.”
Monfredo also hopes for better and extended learning opportunities during summer vacation and programs that would analyze children at an early age to look into factors that could make them a dropout candidate, so that teacher and parents could work with the student to prevent them from dropping out in the future.
“I advocate for an early warning system,” said Monfredo. “The early warning system would look into a variety of factors like absenteeism and early learning habits to determine whether or not the student would have a higher chance of dropping out of school. The system would be a way to look into a variety of early indicators. All of this goes back to prevention; it is money well worth it.”
Related Slideshow: The 50 Least Diverse High Schools in Massachusetts
Prev
Next
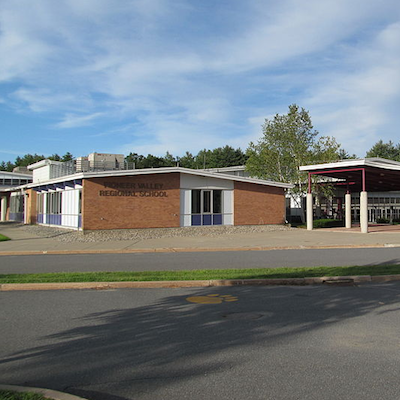
#50 Pioneer Valley Reg.
Northfield, MA
Total enrollment: 500
Percentage of total enrollment
Amer Indian/Alaskan: 0.9%
Asian/Pacific Islander: 1.6%
Black: 1.0%
Hispanic: 2.4%
Two or more races: 1.0%
White: 93.2%

Prev
Next
#49 Health & Human Svc.
Health & Human Svc. HS, Lawrence, MA
Total enrollment: 520
Percentage of total enrollment
Amer Indian/Alaskan: 0.0%
Asian/Pacific Islander: 0.6%
Black: 2.5%
Hispanic: 93.3%
Two or more races: 0.2%
White: 3.5%

Prev
Next
#48 South Shore HS
South Shore Voc. Tech. HS, Hanover, MA
Total enrollment: 600
Percentage of total enrollment
Amer Indian/Alaskan: 0.0%
Asian/Pacific Islander: 0.0%
Black: 2.8%
Hispanic: 2.7%
Two or more races: 1.2%
White: 93.3%

Prev
Next
#47 Seekonk HS
Seekonk, MA
Total enrollment: 628
Percentage of total enrollment
Amer Indian/Alaskan: 0.0%
Asian/Pacific Islander: 2.7%
Black: 0.8%
Hispanic: 2.4%
Two or more races: 0.8%
White: 93.3%

Prev
Next
#46 Athol HS
Athol, MA
Total enrollment: 378
Percentage of total enrollment
Amer Indian/Alaskan: 0.0%
Asian/Pacific Islander: 0.0%
Black: 1.9%
Hispanic: 2.9%
Two or more races: 1.9%
White: 93.4%

Prev
Next
#45 Humanities & Leadership
Humanities & Leadership Dev. HS, Lawrence, MA
Total enrollment: 521
Percentage of total enrollment
Amer Indian/Alaskan: 0.0%
Asian/Pacific Islander: 1.7%
Black: 1.9%
Hispanic: 93.5%
Two or more races: 0.0%
White: 2.9%

Prev
Next
#44 Blackstone Valley
Blackstone Valley Reg. Voc. Tech., Upton, MA
Total enrollment: 1,164
Percentage of total enrollment
Amer Indian/Alaskan: 0.0%
Asian/Pacific Islander: 0.8%
Black: 0.8%
Hispanic: 2.8%
Two or more races: 2.1%
White: 93.5%

Prev
Next
#43 Hopedale Jr. Sr. HS
Hopedale, MA
Total enrollment: 548
Percentage of total enrollment
Amer Indian/Alaskan: 0.5%
Asian/Pacific Islander: 1.6%
Black: 0.5%
Hispanic: 2.6%
Two or more races: 1.1%
White: 93.6%

Prev
Next
#42 Wahconah Reg. HS
Dalton, MA
Total enrollment: 563
Percentage of total enrollment
Amer Indian/Alaskan: 0.0%
Asian/Pacific Islander: 0.7%
Black: 0.9%
Hispanic: 2.0%
Two or more races: 2.7%
White: 93.8%

Prev
Next
#41 W. Wareham Academy
Wareham, MA
Total enrollment: 16
Percentage of total enrollment
Amer Indian/Alaskan: 0.0%
Asian/Pacific Islander: 0.0%
Black: 0.0%
Hispanic: 0.0%
Two or more races: 6.2%
White: 93.8%

Prev
Next
#40 Sutton HS
Sutton, MA
Total enrollment: 418
Percentage of total enrollment
Amer Indian/Alaskan: 0.0%
Asian/Pacific Islander: 0.2%
Black: 0.5%
Hispanic: 1.7%
Two or more races: 3.8%
White: 93.8%

Prev
Next
#39 Bay Path HS
Bay Path Reg. Voc. Tech. HS, Charlton, MA
Total enrollment: 1,104
Percentage of total enrollment
Amer Indian/Alaskan: 0.1%
Asian/Pacific Islander: 0.5%
Black: 0.4%
Hispanic: 4.9%
Two or more races: 0.3%
White: 93.9%

Prev
Next
#38 HS Learning Center
Lawrence, MA
Total enrollment: 167
Percentage of total enrollment
Amer Indian/Alaskan: 0.0%
Asian/Pacific Islander: 1.8%
Black: 1.8%
Hispanic: 94.0%
Two or more races: 0.0%
White: 2.4%

Prev
Next
#37 Shawsheen Valley
Shawsheen Valley Vocational Tech., Billerica, MA
Total enrollment: 1,372
Percentage of total enrollment
Amer Indian/Alaskan: 0.2%
Asian/Pacific Islander: 0.4%
Black: 0.8%
Hispanic: 3.0%
Two or more races: 1.5%
White: 94.1%

Prev
Next
#36 Nipmuc Reg. HS
Upton, MA
Total enrollment: 667
Percentage of total enrollment
Amer Indian/Alaskan: 0.1%
Asian/Pacific Islander: 1.4%
Black: 1.2%
Hispanic: 2.4%
Two or more races: 0.7%
White: 94.0%

Prev
Next
#35 Tewksbury Memorial HS
Tewksbury, MA
Total enrollment: 985
Percentage of total enrollment
Amer Indian/Alaskan: 0.1%
Asian/Pacific Islander: 2.6%
Black: 1.3%
Hispanic: 1.8%
Two or more races: 0.0%
White: 94.1%

Prev
Next
#34 N. Reading HS
North Reading, MA
Total enrollment: 755
Percentage of total enrollment
Amer Indian/Alaskan: 0.0%
Asian/Pacific Islander: 1.9%
Black: 0.5%
Hispanic: 2.0%
Two or more races: 1.5%
White: 94.2%

Prev
Next
#33 Joseph Case HS
Swansea, MA
Total enrollment: 551
Percentage of total enrollment
Amer Indian/Alaskan: 0.2%
Asian/Pacific Islander: 0.9%
Black: 2.0%
Hispanic: 0.9%
Two or more races: 1.6%
White: 94.4%

Prev
Next
#32 Gardner Academy
Gardner Academy for Learning and Tech., Gardner, MA
Total enrollment: 91
Percentage of total enrollment
Amer Indian/Alaskan: 0.0%
Asian/Pacific Islander: 1.1%
Black: 0.0%
Hispanic: 2.2%
Two or more races: 2.2%
White: 94.5%
Prev
Next
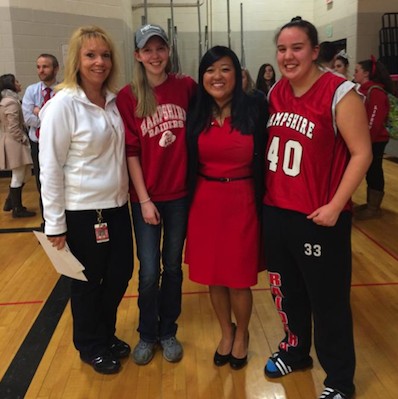
#31 Hampshire Reg. HS
Westhampton, MA
Total enrollment: 756
Percentage of total enrollment
Amer Indian/Alaskan: 0.0%
Asian/Pacific Islander: 0.4%
Black: 0.5%
Hispanic: 2.8%
Two or more races: 1.6%
White: 94.7%

Prev
Next
#30 Triton Reg. HS
Byfield, MA
Total enrollment: 738
Percentage of total enrollment
Amer Indian/Alaskan: 0.0%
Asian/Pacific Islander: 1.2%
Black: 0.5%
Hispanic: 2.7%
Two or more races: 0.8%
White: 94.7%

Prev
Next
#29 Medway HS
Medway, MA
Total enrollment: 779
Percentage of total enrollment
Amer Indian/Alaskan: 0.3%
Asian/Pacific Islander: 1.9%
Black: 0.5%
Hispanic: 1.9%
Two or more races: 0.6%
White: 94.7%

Prev
Next
#28 Apponequet Reg. HS
Lakeville, MA
Total enrollment: 813
Percentage of total enrollment
Amer Indian/Alaskan: 0.2%
Asian/Pacific Islander: 1.1%
Black: 0.6%
Hispanic: 1.5%
Two or more races: 1.8%
White: 94.7%

Prev
Next
#27 Pentucket HS
Pentucket Regional Sen. HS, West Newbury, MA
Total enrollment: 785
Percentage of total enrollment
Amer Indian/Alaskan: 0.0%
Asian/Pacific Islander: 1.4%
Black: 0.4%
Hispanic: 1.9%
Two or more races: 1.5%
White: 94.8%

Prev
Next
#26 Gateway Reg. HS
Huntington, MA
Total enrollment: 282
Percentage of total enrollment
Amer Indian/Alaskan: 0.0%
Asian/Pacific Islander: 0.7%
Black: 0.4%
Hispanic: 2.8%
Two or more races: 1.1%
White: 95.0%

Prev
Next
#25 N. Middlesex Reg. HS
Townsend, MA
Total enrollment: 956
Percentage of total enrollment
Amer Indian/Alaskan: 0.1%
Asian/Pacific Islander: 1.5%
Black: 0.8%
Hispanic: 1.7%
Two or more races: 0.8%
White: 95.1%

Prev
Next
#24 Scituate HS
Scituate, MA
Total enrollment: 947
Percentage of total enrollment
Amer Indian/Alaskan: 0.0%
Asian/Pacific Islander: 0.9%
Black: 2.2%
Hispanic: 0.4%
Two or more races: 1.3%
White: 95.1%
Prev
Next
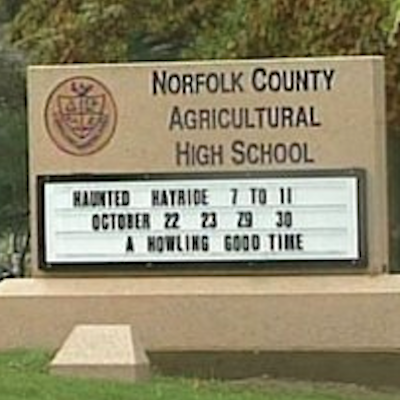
#23 Norfolk County HS
Norfolk County Agricultural HS, Walpole, MA
Total enrollment: 476
Percentage of total enrollment
Amer Indian/Alaskan: 0.0%
Asian/Pacific Islander: 1.1%
Black: 1.1%
Hispanic: 1.5%
Two or more races: 1.1%
White: 95.4%

Prev
Next
#22 Masconomet Reg. HS
Topsfield, MA
Total enrollment: 1,382
Percentage of total enrollment
Amer Indian/Alaskan: 0.1%
Asian/Pacific Islander: 2.2%
Black: 0.4%
Hispanic: 1.7%
Two or more races: 0.1%
White: 95.4%
Prev
Next
#21 King Phillip Reg. HS
Wrentham, MA
Total enrollment: 1,322
Percentage of total enrollment
Amer Indian/Alaskan: 0.3%
Asian/Pacific Islander: 1.1%
Black: 0.8%
Hispanic: 0.7%
Two or more races: 1.4%
White: 95.8%

Prev
Next
#20 Norwell HS
Norwell, MA
Total enrollment: 677
Percentage of total enrollment
Amer Indian/Alaskan: 1.2%
Asian/Pacific Islander: 0.4%
Black: 0.1%
Hispanic: 2.1%
Two or more races: 0.6%
White: 96.0%

Prev
Next
#19 Norton HS
Norton, MA
Total enrollment: 715
Percentage of total enrollment
Amer Indian/Alaskan: 0.0%
Asian/Pacific Islander: 1.6%
Black: 1.1%
Hispanic: 0.8%
Two or more races: 0.3%
White: 95.4%

Prev
Next
#18 Charles McCann
Charles McCann Voc. Tech., North Adams, MA
Total enrollment: 505
Percentage of total enrollment
Amer Indian/Alaskan: 0.0%
Asian/Pacific Islander: 0.4%
Black: 1.0%
Hispanic: 2.0%
Two or more races: 0.8%
White: 95.8%
Prev
Next
#17 Westfield Vocational
Westfield Vocational Tech. HS, Westfield, MA
Total enrollment: 470
Percentage of total enrollment
Amer Indian/Alaskan: 0.0%
Asian/Pacific Islander: 1.5%
Black: 1.5%
Hispanic: 0.6%
Two or more races: 0.4%
White: 96.0%

Prev
Next
#16 Medfield Senior High
Medfield, MA
Total enrollment: 882
Percentage of total enrollment
Amer Indian/Alaskan: 0.0%
Asian/Pacific Islander: 3.3%
Black: 0.3%
Hispanic: 1.6%
Two or more races: 1.5%
White: 93.3%

Prev
Next
#15 Georgetown MS/HS
Georgetown, MA
Total enrollment: 407
Percentage of total enrollment
Amer Indian/Alaskan: 0.0%
Asian/Pacific Islander: 1.0%
Black: 0.0%
Hispanic: 1.2%
Two or more races: 1.5%
White: 96.3%

Prev
Next
#14 Hanover HS
Hanover, MA
Total enrollment: 778
Percentage of total enrollment
Amer Indian/Alaskan: 0.0%
Asian/Pacific Islander: 1.2%
Black: 1.2%
Hispanic: 1.0%
Two or more races: 0.3%
White: 96.4%

Prev
Next
#13 Carver MS/HS
Carver, MA
Total enrollment: 870
Percentage of total enrollment
Amer Indian/Alaskan: 0.2%
Asian/Pacific Islander: 0.1%
Black: 2.3%
Hispanic: 0.3%
Two or more races: 0.7%
White: 96.3%

Prev
Next
#12 Duxbury HS
Duxbury, MA
Total enrollment: 1,037
Percentage of total enrollment
Amer Indian/Alaskan: 0.2%
Asian/Pacific Islander: 1.1%
Black: 0.3%
Hispanic: 0.8%
Two or more races: 1.2%
White: 96.5%

Prev
Next
#11 Westport HS
Westport, MA
Total enrollment: 381
Percentage of total enrollment
Amer Indian/Alaskan: 0.0%
Asian/Pacific Islander: 0.3%
Black: 0.5%
Hispanic: 2.4%
Two or more races: 0.0%
White: 96.9%

Prev
Next
#10 Pembroke HS
Pembroke, MA
Total enrollment: 984
Percentage of total enrollment
Amer Indian/Alaskan: 0.0%
Asian/Pacific Islander: 0.8%
Black: 1.2%
Hispanic: 1.0%
Two or more races: 0.1%
White: 96.8%

Prev
Next
#9 Marshfield HS
Marshfield, MA
Total enrollment: 1,304
Percentage of total enrollment
Amer Indian/Alaskan: 0.1%
Asian/Pacific Islander: 0.6%
Black: 0.2%
Hispanic: 1.8%
Two or more races: 0.5%
White: 96.9%

Prev
Next
#8 Franklin County Tech.
Turners Falls, MA
Total enrollment: 523
Percentage of total enrollment
Amer Indian/Alaskan: 0.2%
Asian/Pacific Islander: 0.6%
Black: 0.0%
Hispanic: 1.0%
Two or more races: 1.3%
White: 96.9%

Prev
Next
#7 Sandwich HS
Sandwich, MA
Total enrollment: 786
Percentage of total enrollment
Amer Indian/Alaskan: 0.1%
Asian/Pacific Islander: 1.8%
Black: 1.1%
Hispanic: 0.0%
Two or more races: 0.0%
White: 96.9%
Prev
Next
#6 Silver Lake Reg. HS
Kingston, MA
Total enrollment: 1,274
Percentage of total enrollment
Amer Indian/Alaskan: 0.1%
Asian/Pacific Islander: 0.7%
Black: 1.5%
Hispanic: 0.2%
Two or more races: 0.2%
White: 97.4%

Prev
Next
#5 Douglas HS
Douglas, MA
Total enrollment: 573
Percentage of total enrollment
Amer Indian/Alaskan: 0.0%
Asian/Pacific Islander: 0.5%
Black: 0.0%
Hispanic: 1.6%
Two or more races: 0.5%
White: 97.4%
Prev
Next
#4 Old Colony Vocational
Old Colony Reg. Vocational Tech., Rochester, MA
Total enrollment: 579
Percentage of total enrollment
Amer Indian/Alaskan: 0.0%
Asian/Pacific Islander: 0.0%
Black: 0.3%
Hispanic: 0.5%
Two or more races: 1.0%
White: 98.1%

Prev
Next
#3 International HS
Lawrence, MA
Total enrollment: 521
Percentage of total enrollment
Amer Indian/Alaskan: 0.0%
Asian/Pacific Islander: 0.6%
Black: 0.2%
Hispanic: 98.5%
Two or more races: 0.0%
White: 0.8%
Prev
Next
#2 Tahanto Regional HS
Boylston, MA
Total enrollment: 542
Percentage of total enrollment
Amer Indian/Alaskan: 0.0%
Asian/Pacific Islander: 0.2%
Black: 0.6%
Hispanic: 0.0%
Two or more races: 0.2%
White: 99.1%

Prev
Next
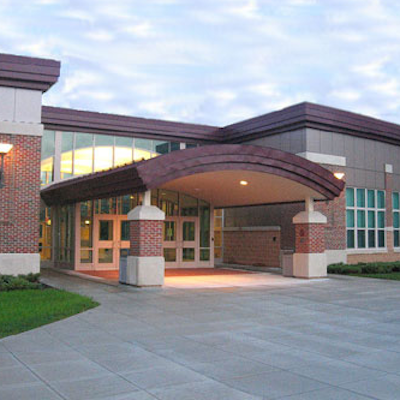
#1 Manchester Essex HS
Manchester Essex Regional HS, Manchester, MA
Total enrollment: 461
Percentage of total enrollment
Amer Indian/Alaskan: 0.0%
Asian/Pacific Islander: 0.0%
Black: 0.4%
Hispanic: 0.0%
Two or more races: 0.2%
White: 99.3%
Related Articles
Enjoy this post? Share it with others.
Email to a friend
Permalink


 Delivered Free Every
Follow us on Pinterest Google + Facebook Twitter See It Read It