Charter Schools Depleting Funding From MA Public School Budgets


 Email to a friend
Permalink
Email to a friend
Permalink
Thursday, June 05, 2014
Nicholas Handy, GoLocalWorcester Contributor
As the Worcester Public School District continues to work on creating and analyzing the school budget for the upcoming fiscal year, a degree of animosity still remains when thinking of charter schools.
According to the Department of Elementary and Secondary Education, 2,002 students are projected to leave the Worcester Public School District in the 2015 fiscal year, with 64 leaving the Worcester district for another city altogether.
“Charter schools hinder public school budgets because a whole new set of administration, teachers, supplies, and more is needed,” said Brian Allen, Chief Financial & Operations Officer of the Worcester Public School District. “Having stand-alone school districts are taking away funding from the public schools around them. I don’t believe that this is the most effective way to have tax dollars spent.”
With a projected budget that will force the district to make some tough cuts to teachers and programs, many are pointing their fingers at charter schools as the reason for the funding shortages. Those advocating for charter schools, however, point to the reimbursement program set up by the state as a way for districts to get their money back, nullifying all monetary issues.
Funding Give and Take
When students leave a public school district for a charter school, a few things happen financially. The money follows the student to their destination, but the state reimbursement program offers refunds to the school that lost a student.
The refund is based on a formula which takes into account the net school spending on a per pupil basis. The first year that a student transfers, 100-percent the money is refunded – which is around $10,000 in Worcester - and then for the following five years, 25-percent is refunded.
While recognized as a generous way to account for the loss of a student, the reimbursements have been underfunded in the past. Although a recent supplemental budget brought the percentage closer to 100-percent, the fiscal year 2014 reimbursement rates were only at 63-percent.
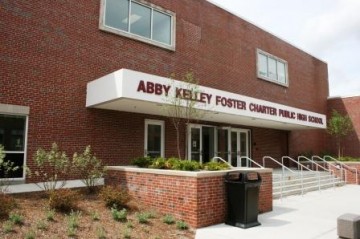
Abby Kelley Foster Charter Public School, located in Worcester
Public school districts are also still on the hook for transportation costs to students who attend a Worcester-based charter schools, even though the charter schools are not a part of the district.
“If the charter school is in Worcester then we are still required to transport the student,” said Allen. “The problem with transportation is that even if the bus routes are similar, the schedule of a charter school may be entirely different then our school district.”
An Overblown Issue
Public school officials have been condemning charter schools since their inception, citing that they are pulling away finances and students from their districts, but Dominic Slowey, a spokesperson for the Massachusetts Charter Public School Association, says that these claims have been disproved and overblown.
“The reimbursement system pays the public school district for a total of six years,” said Slowey. “That is six years that a district is being paid by the state where they are not required to educate the student.”
Slowey also points out that public school districts need more money every year but that is to be expected with inflation costs. And even if the district needs more money, the number of students leaving Worcester Public Schools has remained relatively unchanged over the past few years.
Looking back five years into Department of Elementary and Secondary Education databases, the number of students leaving the Worcester Public School District has actually dropped slightly from 2,110 in fiscal year 2011 to 2,002 in fiscal year 2015.
“Parents should be able to choose where their child and where their tax dollars are going,” said Slowey. “The tension between charter schools and public schools almost always comes down to money. Because of the formula and the way the system works, Worcester hasn’t been gaining or losing money because the amount of students leaving has remained relatively unchanged.”
Related Slideshow: The 50 Most Diverse High Schools in Massachusetts

Prev
Next
#50 Curtis-Tufts HS
Medford, MA
Total enrollment: 67
Percentage of total enrollment
Amer Indian/Alaskan: 0.0%
Asian/Pacific Islander: 4.5%
Black: 27.3%
Hispanic: 13.6%
Two or more races: 0.0%
White: 54.5%

Prev
Next
#49 Boston Green Acad.
Boston Green Acad. Horace Mann Charter, Boston, MA
Total enrollment: 324
Percentage of total enrollment
Amer Indian/Alaskan: 0.3%
Asian/Pacific Islander: 2.8%
Black: 53.1%
Hispanic: 28.4%
Two or more races: 0.3%
White: 15.1%

Prev
Next
#48 Fitchburg HS
Fitchburg, MA
Total enrollment: 1,116
Percentage of total enrollment
Amer Indian/Alaskan: 0.1%
Asian/Pacific Islander: 7.0%
Black: 7.3%
Hispanic: 44.8%
Two or more races: 4.1%
White: 36.6%

Prev
Next
#47 Global Learning
Global Learning Charter Public HS, New Bedford, MA
Total enrollment: 501
Percentage of total enrollment
Amer Indian/Alaskan: 0.8%
Asian/Pacific Islander: 1.0%
Black: 12.6%
Hispanic: 27.9%
Two or more races: 4.2%
White: 53.5%

Prev
Next
#46 Lowell Middlesex
Lowell Middlesex Acad. Charter HS, Lowell, MA
Total enrollment: 99
Percentage of total enrollment
Amer Indian/Alaskan: 0.0%
Asian/Pacific Islander: 11.1%
Black: 2.0%
Hispanic: 38.4%
Two or more races: 5.1%
White: 42.4%

Prev
Next
#45 Community Academy
Jamaica Plain, MA
Total enrollment: 67
Percentage of total enrollment
Amer Indian/Alaskan: 0.0%
Asian/Pacific Islander: 0.0%
Black: 40.3%
Hispanic: 16.4%
Two or more races: 3.0%
White: 40.3%

Prev
Next
#44 Quincy HS
Quincy, MA
Total enrollment: 1,519
Percentage of total enrollment
Amer Indian/Alaskan: 0.7%
Asian/Pacific Islander: 23.9%
Black: 9.8%
Hispanic: 7.4%
Two or more races: 1.8%
White: 56.3%

Prev
Next
#43 Foxborough Regional
Foxborough Reg. Charter HS, Foxborough, MA
Total enrollment: 1,265
Percentage of total enrollment
Amer Indian/Alaskan: 0.0%
Asian/Pacific Islander: 10.4%
Black: 23.8%
Hispanic: 5.1%
Two or more races: 4.5%
White: 56.3%

Prev
Next
#42 Boston Collegiate
Boston Collegiate Charter HS, Dorchester, MA
Total enrollment: 632
Percentage of total enrollment
Amer Indian/Alaskan: 0.3%
Asian/Pacific Islander: 1.9%
Black: 25.5%
Hispanic: 15.7%
Two or more races: 2.2%
White: 54.4%

Prev
Next
#41 Full Circle HS
Somerville, MA
Total enrollment: 56
Percentage of total enrollment
Amer Indian/Alaskan: 0.0%
Asian/Pacific Islander: 1.8%
Black: 21.4%
Hispanic: 35.7%
Two or more races: 1.8%
White: 39.3%

Prev
Next
#40 Waltham Senior HS
Waltham, MA
Total enrollment: 1,389
Percentage of total enrollment
Amer Indian/Alaskan: 0.1%
Asian/Pacific Islander: 6.4%
Black: 11.2%
Hispanic: 30.6%
Two or more races: 2.6%
White: 49.1%

Prev
Next
#39 Medford HS
Medford MA
Total enrollment: 1,155
Percentage of total enrollment
Amer Indian/Alaskan: 0.3%
Asian/Pacific Islander: 10.0%
Black: 18.4%
Hispanic: 8.2%
Two or more races: 1.9%
White: 61.9%

Prev
Next
#38 Snowden International
Snowden Int'l School at Copley, Boston, MA
Total enrollment: 397
Percentage of total enrollment
Amer Indian/Alaskan: 0.3%
Asian/Pacific Islander: 7.6%
Black: 38.3%
Hispanic: 41.3%
Two or more races: 3.0%
White: 9.6%

Prev
Next
#37 Brockton HS
Brockton Champion HS, Brockton, MA
Total enrollment: 194
Percentage of total enrollment
Amer Indian/Alaskan: 0.5%
Asian/Pacific Islander: 1.0%
Black: 41.2%
Hispanic: 19.6%
Two or more races: 2.6%
White: 35.1%

Prev
Next
#36 Worcester Tech. HS
Worcester, MA
Total enrollment: 1,358
Percentage of total enrollment
Amer Indian/Alaskan: 0.5%
Asian/Pacific Islander: 5.8%
Black: 12.4%
Hispanic: 34.6%
Two or more races: 2.2%
White: 44.5%

Prev
Next
#35 Acad. of the Pac. Rim
Acad. of the Pac. Rim Charter Public HS, Hyde Park MA
Total enrollment: 498
Percentage of total enrollment
Amer Indian/Alaskan: 0.0%
Asian/Pacific Islander: 1.4%
Black: 58.4%
Hispanic: 20.5%
Two or more races: 3.4%
White: 16.3%

Prev
Next
#34 Lynn Vocational
Lynn Vocational Tech. Institute, Lynn, MA
Total enrollment: 750
Percentage of total enrollment
Amer Indian/Alaskan: 0.8%
Asian/Pacific Islander: 6.7%
Black: 10.7%
Hispanic: 60.0%
Two or more races: 2.9%
White: 18.9%

Prev
Next
#33 Boston Arts Academy
Boston, MA
Total enrollment: 445
Percentage of total enrollment
Amer Indian/Alaskan: 0.4%
Asian/Pacific Islander: 3.1%
Black: 38.7%
Hispanic: 40.0%
Two or more races: 2.2%
White: 15.5%

Prev
Next
#32 Greater Lowell
Greater Lowell Reg. Vocational Tech., Tyngsborough, MA
Total enrollment: 2,112
Percentage of total enrollment
Amer Indian/Alaskan: 0.5%
Asian/Pacific Islander: 14.8%
Black: 3.9%
Hispanic: 26.6%
Two or more races: 2.6%
White: 51.7%
Prev
Next
#31 Amherst Regional HS
Amherst, MA
Total enrollment: 1,004
Percentage of total enrollment
Amer Indian/Alaskan: 0.1%
Asian/Pacific Islander: 10.0%
Black: 8.3%
Hispanic: 12.2%
Two or more races: 8.4%
White: 61.2%

Prev
Next
#30 Horace Mann
Horace Mann School for the Deaf, Allston, MA
Total enrollment: 111
Percentage of total enrollment
Amer Indian/Alaskan: 0.0%
Asian/Pacific Islander: 9.0%
Black: 36.0%
Hispanic: 41.4%
Two or more races: 1.8%
White: 11.7%

Prev
Next
#29 Everett HS
Everett, MA
Total enrollment: 2,004
Percentage of total enrollment
Amer Indian/Alaskan: 0.3%
Asian/Pacific Islander: 4.9%
Black: 23.9%
Hispanic: 32.4%
Two or more races: 1.0%
White: 37.5%

Prev
Next
#28 Lynn English HS
Lynn, MA
Total enrollment: 1,611
Percentage of total enrollment
Amer Indian/Alaskan: 0.1%
Asian/Pacific Islander: 9.9%
Black: 10.8%
Hispanic: 53.0%
Two or more races: 2.2%
White: 24.0%
Prev
Next
#27 Boston Latin HS
Boston, MA
Total enrollment: 2,379
Percentage of total enrollment
Amer Indian/Alaskan: 0.0%
Asian/Pacific Islander: 29.1%
Black: 9.5%
Hispanic: 10.6%
Two or more races: 3.1%
White: 47.7%
Prev
Next
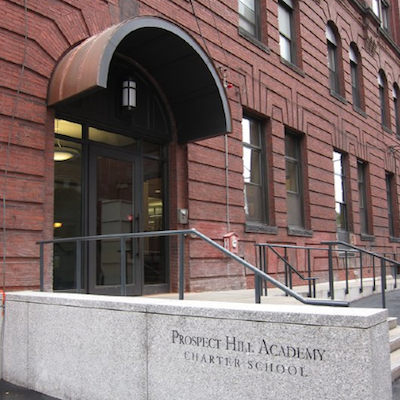
#26 Prospect Hill
Prospect Hill Academy Charter HS, Cambridge, MA
Total enrollment: 1,148
Percentage of total enrollment
Amer Indian/Alaskan: 0.3%
Asian/Pacific Islander: 6.9%
Black: 57.2%
Hispanic: 19.6%
Two or more races: 3.0%
White: 13.0%

Prev
Next
#25 Brookline HS
Brookline, MA
Total enrollment: 1,832
Percentage of total enrollment
Amer Indian/Alaskan: 0.0%
Asian/Pacific Islander: 14.8%
Black: 7.9%
Hispanic: 10.3%
Two or more races: 7.0%
White: 60.0%

Prev
Next
#24 New Bedford HS
New Bedford, MA
Total enrollment: 2,436
Percentage of total enrollment
Amer Indian/Alaskan: 0.8%
Asian/Pacific Islander: 1.7%
Black: 14.8%
Hispanic: 31.1%
Two or more races: 6.5%
White: 45.0%

Prev
Next
#23 Randolph HS
New Bedford, MA
Total enrollment: 746
Percentage of total enrollment
Amer Indian/Alaskan: 0.5%
Asian/Pacific Islander: 17.4%
Black: 58.7%
Hispanic: 9.0%
Two or more races: 1.6%
White: 12.7%

Prev
Next
#22 Charlestown HS
Charlestown, MA
Total enrollment: 935
Percentage of total enrollment
Amer Indian/Alaskan: 0.4%
Asian/Pacific Islander: 20.2%
Black: 41.9%
Hispanic: 30.4%
Two or more races: 0.9%
White: 6.2%

Prev
Next
#21 Burncoat Senior HS
Worcester, MA
Total enrollment: 996
Percentage of total enrollment
Amer Indian/Alaskan: 0.4%
Asian/Pacific Islander: 5.1%
Black: 17.1%
Hispanic: 39.8%
Two or more races: 2.1%
White: 35.5%

Prev
Next
#20 Springfield Ren.
Springfield Renaissance School, Springfield, MA
Total enrollment: 705
Percentage of total enrollment
Amer Indian/Alaskan: 0.1%
Asian/Pacific Islander: 1.4%
Black: 25.5%
Hispanic: 42.6%
Two or more races: 6.1%
White: 24.3%

Prev
Next
#19 Sabis International
Sabis Int'l Charter School, Springfield, MA
Total enrollment: 1,574
Percentage of total enrollment
Amer Indian/Alaskan: 0.0%
Asian/Pacific Islander: 2.8%
Black: 30.1%
Hispanic: 33.2%
Two or more races: 5.2%
White: 28.2%

Prev
Next
#18 Quincy Upper HS
Boston, MA
Total enrollment: 487
Percentage of total enrollment
Amer Indian/Alaskan: 0.0%
Asian/Pacific Islander: 53.2%
Black: 20.7%
Hispanic: 16.8%
Two or more races: 2.3%
White: 7.0%

Prev
Next
#17 Springfield Central HS
Springfield, MA
Total enrollment: 2,086
Percentage of total enrollment
Amer Indian/Alaskan: 0.0%
Asian/Pacific Islander: 6.6%
Black: 24.1%
Hispanic: 49.8%
Two or more races: 3.7%
White: 15.7%
Prev
Next
#16 Mystic Valley
Mystic Valley Reg. Charter HS, Malden, MA
Total enrollment: 1,499
Percentage of total enrollment
Amer Indian/Alaskan: 0.1%
Asian/Pacific Islander: 16.0%
Black: 16.6%
Hispanic: 6.2%
Two or more races: 3.9%
White: 57.2%

Prev
Next
#15 Univ. Park Campus
University Park Campus HS, Worcester, MA
Total enrollment: 230
Percentage of total enrollment
Amer Indian/Alaskan: 0.0%
Asian/Pacific Islander: 23.9%
Black: 7.4%
Hispanic: 49.3%
Two or more races: 2.2%
White: 18.3%

Prev
Next
#14 Doherty Mem. HS
Worcester, MA
Total enrollment: 1,337
Percentage of total enrollment
Amer Indian/Alaskan: 0.6%
Asian/Pacific Islander: 9.3%
Black: 14.1%
Hispanic: 30.3%
Two or more races: 2.2%
White: 43.4%

Prev
Next
#13 North HS
Worcester, MA
Total enrollment: 1,295
Percentage of total enrollment
Amer Indian/Alaskan: 0.2%
Asian/Pacific Islander: 8.3%
Black: 19.2%
Hispanic: 46.4%
Two or more races: 1.7%
White: 24.2%

Prev
Next
#12 Lowell HS
Lowell, MA
Total enrollment: 3,054
Percentage of total enrollment
Amer Indian/Alaskan: 0.1%
Asian/Pacific Islander: 32.5%
Black: 9.7%
Hispanic: 24.1%
Two or more races: 1.1%
White: 32.4%

Prev
Next
#11 Whaling City Alt.
Whaling City Alternative HS, New Bedford, MA
Total enrollment: 99
Percentage of total enrollment
Amer Indian/Alaskan: 2.0%
Asian/Pacific Islander: 1.0%
Black: 20.2%
Hispanic: 37.4%
Two or more races: 8.1%
White: 31.4%

Prev
Next
#10 Somerville HS
Somerville, MA
Total enrollment: 1,265
Percentage of total enrollment
Amer Indian/Alaskan: 0.2%
Asian/Pacific Islander: 11.6%
Black: 15.3%
Hispanic: 39.8%
Two or more races: 0.9%
White: 32.3%

Prev
Next
#9 Pioneer Charter
Pioneer Charter School of Science, Everett, MA
Total enrollment: 359
Percentage of total enrollment
Amer Indian/Alaskan: 2.5%
Asian/Pacific Islander: 8.7%
Black: 37.0%
Hispanic: 17.8%
Two or more races: 0.6%
White: 33.4%

Prev
Next
#8 Lynn Classical HS
Lynn, MA
Total enrollment: 1,498
Percentage of total enrollment
Amer Indian/Alaskan: 0.1%
Asian/Pacific Islander: 11.8%
Black: 14.3%
Hispanic: 45.6%
Two or more races: 2.7%
White: 25.4%

Prev
Next
#7 Cambridge Rindge
Cambridge Rindge and Latin, Cambridge, MA
Total enrollment: 1,741
Percentage of total enrollment
Amer Indian/Alaskan: 0.6%
Asian/Pacific Islander: 11.8%
Black: 33.2%
Hispanic: 14.0%
Two or more races: 3.0%
White: 37.5%

Prev
Next
#6 Fecteau-Leary
Fecteau-Leary Junior/Senior HS, Lynn, MA
Total enrollment: 157
Percentage of total enrollment
Amer Indian/Alaskan: 0.6%
Asian/Pacific Islander: 8.3%
Black: 19.7%
Hispanic: 43.3%
Two or more races: 3.8%
White: 24.2%

Prev
Next
#5 O'Bryant HS
Roxbury, MA
Total enrollment: 1,353
Percentage of total enrollment
Amer Indian/Alaskan: 0.1%
Asian/Pacific Islander: 21.3%
Black: 37.2%
Hispanic: 28.6%
Two or more races: 1.6%
White: 11.1%

Prev
Next
#4 Excel HS
South Boston, MA
Total enrollment: 550
Percentage of total enrollment
Amer Indian/Alaskan: 0.5%
Asian/Pacific Islander: 22.5%
Black: 38.4%
Hispanic: 23.3%
Two or more races: 1.6%
White: 13.6%

Prev
Next
#3 South HS
Worcester, MA
Total enrollment: 1,264
Percentage of total enrollment
Amer Indian/Alaskan: 0.6%
Asian/Pacific Islander: 14.9%
Black: 19.6%
Hispanic: 39.2%
Two or more races: 1.7%
White: 24.1%

Prev
Next
#2 Boston Latin Acad.
Dorchester, MA
Total enrollment: 1,689
Percentage of total enrollment
Amer Indian/Alaskan: 0.7%
Asian/Pacific Islander: 21.6%
Black: 27.1%
Hispanic: 20.7%
Two or more races: 1.8%
White: 28.2%

Prev
Next
#1 Malden HS
Malden, MA
Total enrollment: 1,835
Percentage of total enrollment
Amer Indian/Alaskan: 0.7%
Asian/Pacific Islander: 24.9%
Black: 22.6%
Hispanic: 19.9%
Two or more races: 3.7%
White: 28.3%
Related Articles
Enjoy this post? Share it with others.
Email to a friend
Permalink


Follow us on Pinterest Google + Facebook Twitter See It Read It