Exclusive US Education Rankings: Where Does Mass. Stand?


Saturday, April 21, 2012
“I think we work hard to provide the best bang for the buck,” said Worcester City Councilor Frederick Rushton. “We’re always looking for ways to squeeze an extra couple of pennies out of every dollar.”
“I think, on the whole, school systems do spend their dollars carefully and wisely,” said Brian O'Connell, a member of the Worcester School Committee.
The Bay State spends $14,540 per pupil, the ninth highest rate in the nation when DC is counted.
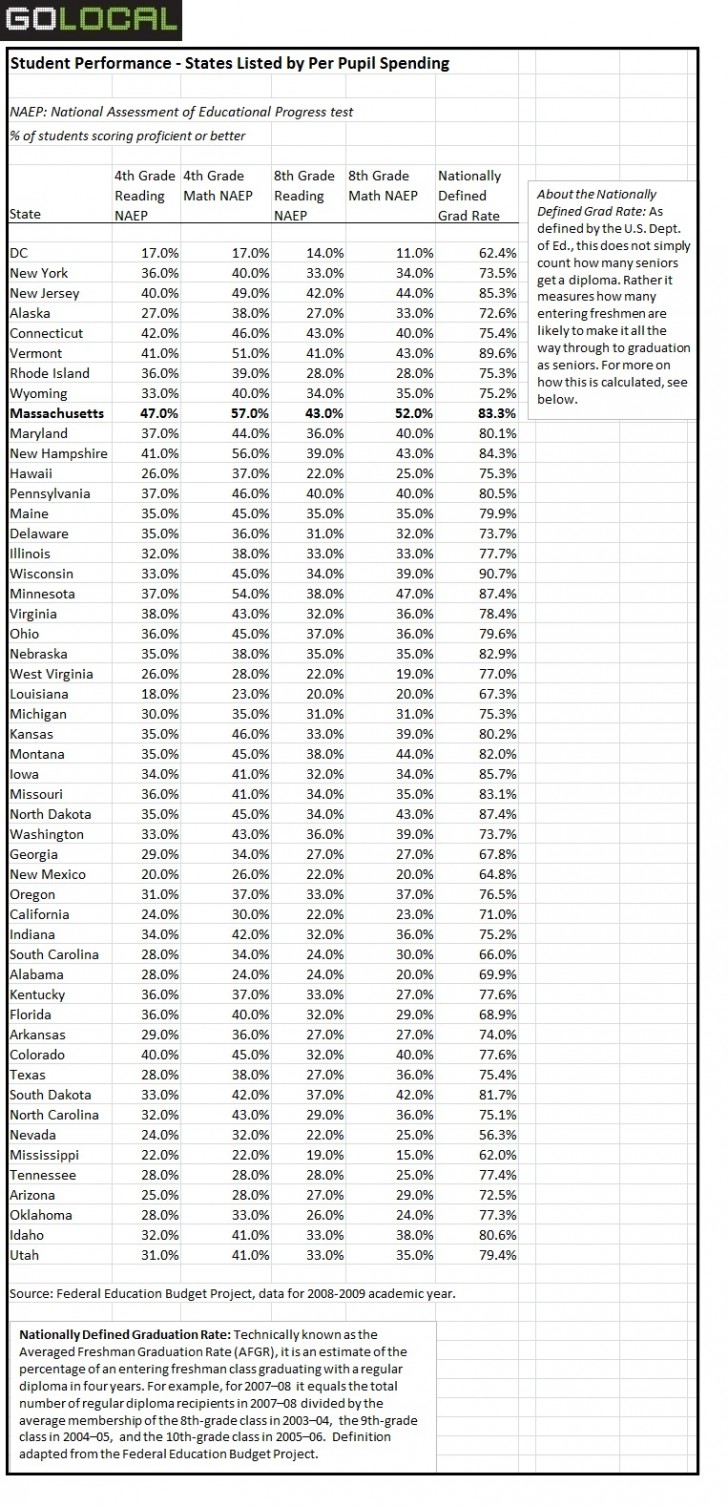
In an effort to fairly measure the effectiveness of that spending, GoLocalWorcester ranked each state by how much it spends per pupil.
Student performance was then measured by the math and reading scores of fourth and eighth graders on the National Assessment of Education Progress (NAEP) test, which is administered to samples of students in all 50 states. The NAEP test offers a single benchmark against which to compare all states, rather than the individual state tests (like the MCAS in Massachusetts), which vary widely in standards from one area to another.
The ranking also takes into account the four-year graduation rates across the country, using data culled from the Federal Education Budget Project.
Is the spending worth it?
The results were compared with the per-pupil rankings in order to see how much of an impact spending is having on student achievement. In other words: How much of a return is Massachusetts getting on its investment?
The answer: quite a bit—at least, when compared to other states.
Massachusetts students successfully complete high school at a rate of 83.3 percent, well above the national average of 76.4 percent. But it’s the Bay State’s scores on the fourth grade reading and math NAEP tests—47 percent and 57 percent proficient, respectively—that put it above most of its peers.
The eighth grade scores are less impressive—43 percent on reading and 52 percent on math—but still above the norm in 2008-2009, the school year for which the most recent data is available for the entire country in the categories examined.
Room for improvement

Closing the achievement gap for minority students, those with learning disabilities, and students who speak English as a second language is among the top priorities for the state, according to Considine. Another no-less significant challenge: turning around an estimated 40 schools that have been identified as the lowest performing ones in the state.
Where does Worcester stand?
Those challenges are especially acute in Worcester public schools, where approximately 70 percent of students qualify for the free and reduced lunch program—one of the most common measures of low-income households—and roughly a quarter of students do not speak English as their first language, according to O’Connell.
“We actually struggle on many fronts,” O'Connell said.
Worcester also has three of the state’s lowest performing schools, according to O’Connell and Considine. Two of the schools, he said, are in neighborhoods that are “socially and economically distressed.” The other is in a middle class area but draws students who are predominantly low-income. Almost all but a handful of the roughly 350 students who attend one of the lowest performing schools, the Union Hill elementary school, are on the free and reduced lunch program, O’Connell noted.
Such socio-economic factors are reflected in how Worcester students perform relative to the statewide average.
Worcester lags behind the rest of Massachusetts by 10 percentage points in its graduation rate, with just 73.4 percent of students finishing high school in 2009-2010, according to a spring 2011 report by Superintendent Melinda Boone. (Boone was unavailable for comment on this report.)
The gap is even wider in standardized test scores. Thirty four percent of Worcester fourth graders were proficient or better on the English and language arts section of the MCAS, as compared with the statewide rate of 53 percent in spring 2011. A similar 20-point gap separates Worcester fourth graders from their statewide peers on the math portion of the test—29 percent proficient to 47 percent, according to Massachusetts Department of Education data.

Considine said the Worcester School District is at the “front and center” of state efforts to continue to improve its education system. “They’re one of our largest school districts and they also have some of our lowest performing schools,” he said.
Rankings show money isn’t everything
If there’s any conclusion that can be drawn by comparing all 50 states, it’s that educational excellence cannot be measured by how much a state spends. “It has more to do with how they spend it than what they’re spending,” said Jennifer Cohen, a senior policy analyst for the Federal Education Budget Project, which is maintained by the New America Foundation.
For example, New Jersey and New York are separated by roughly $700 in per pupil spending: both spend about $17,000, more than any other state, excepting DC. But the two states are miles apart when it comes to student performance. New Jersey students rank fifth; their New York peers, on the other hand, are 26th.
Among the top ten biggest spenders, about half are also at the top for performance. But the rest are stuck in the middle or lower. That includes states like Alaska, which is the sixth highest spender per student, but the 36th for achievement, and Wyoming, which ranks eighth and 25th, respectively.
A number of the highest performing states are not at the top in spending. North Dakota, for example, ranks 29th in per pupil costs. But its students are the seventh best in the country. At just over $11,000 per pupil, Minnesota ranks 18th, but its students beat out most of their northeastern peers, ranking third overall. South Dakota spends half as much as Connecticut on its students, but it still manages to get them to perform 12th in the nation. Connecticut students rank sixth.
Meanwhile, the biggest spender on the list, DC, is also the lowest performer.
Why is Massachusetts No. 1?
The Bay State is nearly tied with its smaller neighbor to the south, Rhode Island, in per pupil spending: both hover around $14,000. But the two states are at different ends of the spectrum when it comes to performance, with Rhode Island languishing at the 32nd in the nation for student achievement.
Experts tell different tales of how Massachusetts got to its number one spot, but almost all seem to agree on where it started: the Massachusetts Education Reform Act of 1993, which combined increased standards and a more rigorous accountability system with a significant infusion of state funds into local school districts, according to Considine.
A number of key changes to the state public education system followed. At the statewide level, Massachusetts established the “foundation” budget, which is what a school district has to spend on each student to guarantee an adequate education. The MCAS also emerged out of the reform effort and now is a graduation requirement for high school students.
Massachusetts success a mystery to some
To the rest of the country, Massachusetts is a “ponderance,” Cohen said, especially since some education reformers view teacher unions as an obstacle to improvement. But Massachusetts, with a high rate of union membership among teachers, has shown a different way to education reform, Cohen said.
One expert says the issue is not unions as much as it is the collective bargaining agreements they have with school districts. Lisa Blais, an education consultant based in Rhode Island, said teachers contracts in Massachusetts have provided for more teacher accountability, focused more on student performance, and allowed for more flexibility in things like the length of the school day than contracts in her state.
“I think Massachusetts is higher because of these reforms and they started many years ago,” Blais said.
O’Connell, on the other hand, credits the political culture of Massachusetts with making all the difference. He said the state boasts a highly educated and successful population that passes on enthusiasm and value for education onto the next generation. Plus, he said young people can see how a good education feeds into the many careers that are available to them in their state.
Official: Worcester needs to spend more
At the national or state level, the debate on education spending may revolve around how to spend money, rather than what amount to spend—but that isn’t the case in Worcester and surrounding communities, O’Connell said. The issue facing those communities, according to O’Connell, is that they are not spending enough.
In Worcester, he said the city is spending the bare minimum of what the state says it should—about 5 percent below what is known as the “minimum net school spending.”
“That’s not really a long-term investment in education,” O’Connell said.
To be fair, Worcester is devoting a lot of attention to capital improvements on its schools—and that spending is not being counted by the state, O’Connell said. But he still worries that Worcester is paying more attention to city services like police, fire, and public works—at the expense of education.
Ruston agreed that the city “could probably spend more,” but he did not agree with O’Connell's assessment of the city’s priorities. “We’re just trying to balance the needs in an economy that’s clearly coming out of the worst recession in my lifetime,” he said.

Related Articles
- Central Mass Schools Make Princeton Review’s Green Colleges
- College Admissions: Who Really Gets in to Ivy League Schools
- 122 Children at Sullivan Middle School are Homeless
- AMSA Charter School and the Myth of the Dot-Com Bust
- Budget-Stricken Wachusett Schools Spend Millions on Custodians


 Delivered Free Every
Follow us on Pinterest Google + Facebook Twitter See It Read It