How White is Your School? The Most Diverse High Schools in MA


 Email to a friend
Permalink
Email to a friend
Permalink
Tuesday, March 25, 2014
Kate Nagle, GoLocal Contributor
Where are Massachusetts' most diverse high schools? Most fall in the Commonwealth's urban areas, and that includes Worcester being well represented, with South High School, North High School, Doherty Memorial High School, University Park School, and Burncoat Senior High landing in the top 25 most diverse high schools in all of Massachusetts.
"We have a very diverse student body, which is great," said Worcester City Councilor Sarai Rivera. "The challenge is staffing the schools with teachers and administrators to reflect that."
See MA's Most Diverse High Schools BELOW
GoLocal looked at the most recent data from the National Center for Education Statistics, which collects enrollment data from the states' public high schools, vocational-technical high schools and charter high schools, and breaks it down into six racial/ethnic categories: American Indian/Alaskan, Asian/Pacific Islander, Black, Hispanic, Two or More Races, and White.
In order to determine the high school with the most diverse student body, GoLocal judged each against an "ideal" student population with an equal share, or 16.66 percent, of each of the six categories represented in the total enrollment. The closer a high school came to that ideal student population, the higher they ranked.
Looking at Numbers -- and Impact
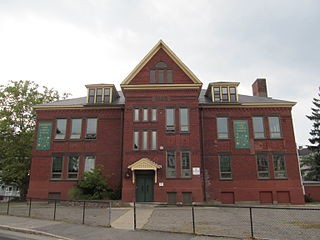
University Park School is one of Worcester's, and MA's, most diverse high schools.
Worcester School Committee member and GoLocal Mindsetter John Monfredo recently took a look at the latest enrollment numbers for all of Worcester, noting on the findings, as well as trends.
"The demographics in our city have changed greatly and therefore so have the diversity in our schools," Monfredo wrote in an article for GoLocal in January. "Let’s look some of the statistics… the Afro-American population in our schools is 16.6%, Asian population is 8.1%, Hispanic population leads with 37.5% and the white population is 37.3%."
He continued, "In addition, there are more than 80 languages spoken in our schools. In 1995, the minority population in the schools was 42.1% with the Hispanic percentage being 25.6% and the white population at 57.1%. In 2013, the minority population is up to 62.7% with the Hispanic population increasing to 37.5% and the white population as mentioned at 37.3%."
Former Worcester GOP State Rep candidate Carol Claros shared her perspective on the opportunities -- and challenges -- facing a diverse student body.
"Having a diverse population helps to reduce the stress on students by creating an accepting feeling for everyone thus promoting a better learning environment," said Claros. "It also opens their eyes to other cultures and fosters curiosity to learn about others further breaking down stereotypes."
Claros said, "The challenges are from outside sources and peer pressure telling them not to like someone because of their background. A good example would be someone who is a practicing Muslim, you know them as a friend but the media and friends say those people caused 9/11 or bombed a school overseas."
Diversity in Worcester Schools
"Diversity as it euphemistically called is really the full promise of Brown vs. Board of Education," said Worcester activist Jordan Berg Powers. "Diverse schools are the goal because they train our kids to see other children as equal and a part of their community. It arms them with the ability to navigate the complexities of the real world and it ensures that regardless of race or wealth of the family we are bound together in making sure our children have the resources they need."
He continued, "The report makes it clear our poor districts, which Worcester is one, need money, lots of it. To make sure they have the resources to provide a complexity of course offerings, lots of qualified teachers and the wrap around services to make sure they are not ending up in the school to prison pipeline. In those efforts there are a few good voices but overwhelming the school committee and administration is a failure. They are too focused on testing and not enough on equality of opportunity."
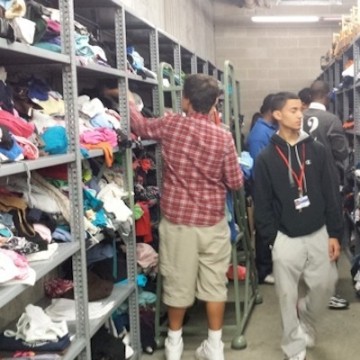
Andy's Attic clothing pantry at South High
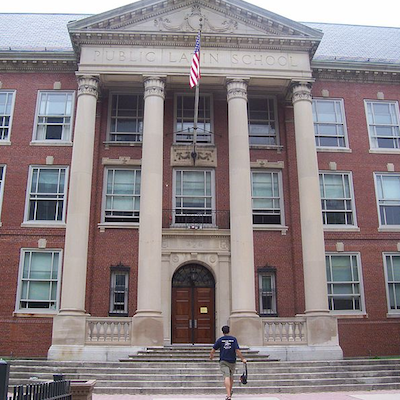
South High was the third most diverse school in Massachusetts (and most diverse in Worcester), according to GoLocal's analysis of most recent school reporting data. Out of a total enrollment of just over 1,250 students, 14 percent of students are Asian/Pacific Islanders, 19.6% of students are black/Afro-American, 24.1% white, and 39.2% Hispanic.
Principal Maureen Binienda spoke to the role that diversity played at the school -- and the opportunities available for students.
"One of the most exciting things we did this year was that we partnered with Hanover Theater," said Binienda. "Everyone at school was able to participate in the show Memphis. For one month, in every single English class, they learned about the literature, the history of the show. The whole school got involved in this community service project, and Hanover Theater took our artwork, essays, projects, and they covered the theater with it. It brought everyone together....to be able to take a Broadway show to a diverse school and have everyone participate, we're hoping to do it again in the future."
Binienda noted the role of community service at the school -- and the impact it had on the diverse student population.
"We opened a clothing pantry in our school," said Binienda. "We were recipients of the pantry, and we took it over. Now we're running it like a business. Our students oversee the distribution for all of Central Massachusetts. 80 bags at a time can come out of there. We have 36 kids a day volunteering, helping people who don't have clothing. It has completely added to our sense of community. Sometimes you hear in the news that teens don't care about the world. This is an inspiration."
"Our AP scores are up this year, and we saw a large increase -- and exceeded our goals -- for the English MCAS," said Binienda. "We accept every opportunity that comes our way, because we need to. We need to partner with as many groups as we can, so we can become the resource for our students, and they in turn become the resource for their families, and communities."
See the Full Chart of Most -- and Least -- Diverse Schools in Massachusetts HERE
See Methodology HERE
Related Slideshow: The 50 Most Diverse High Schools in Massachusetts

Prev
Next
#50 Curtis-Tufts HS
Medford, MA
Total enrollment: 67
Percentage of total enrollment
Amer Indian/Alaskan: 0.0%
Asian/Pacific Islander: 4.5%
Black: 27.3%
Hispanic: 13.6%
Two or more races: 0.0%
White: 54.5%

Prev
Next
#49 Boston Green Acad.
Boston Green Acad. Horace Mann Charter, Boston, MA
Total enrollment: 324
Percentage of total enrollment
Amer Indian/Alaskan: 0.3%
Asian/Pacific Islander: 2.8%
Black: 53.1%
Hispanic: 28.4%
Two or more races: 0.3%
White: 15.1%

Prev
Next
#48 Fitchburg HS
Fitchburg, MA
Total enrollment: 1,116
Percentage of total enrollment
Amer Indian/Alaskan: 0.1%
Asian/Pacific Islander: 7.0%
Black: 7.3%
Hispanic: 44.8%
Two or more races: 4.1%
White: 36.6%

Prev
Next
#47 Global Learning
Global Learning Charter Public HS, New Bedford, MA
Total enrollment: 501
Percentage of total enrollment
Amer Indian/Alaskan: 0.8%
Asian/Pacific Islander: 1.0%
Black: 12.6%
Hispanic: 27.9%
Two or more races: 4.2%
White: 53.5%

Prev
Next
#46 Lowell Middlesex
Lowell Middlesex Acad. Charter HS, Lowell, MA
Total enrollment: 99
Percentage of total enrollment
Amer Indian/Alaskan: 0.0%
Asian/Pacific Islander: 11.1%
Black: 2.0%
Hispanic: 38.4%
Two or more races: 5.1%
White: 42.4%

Prev
Next
#45 Community Academy
Jamaica Plain, MA
Total enrollment: 67
Percentage of total enrollment
Amer Indian/Alaskan: 0.0%
Asian/Pacific Islander: 0.0%
Black: 40.3%
Hispanic: 16.4%
Two or more races: 3.0%
White: 40.3%

Prev
Next
#44 Quincy HS
Quincy, MA
Total enrollment: 1,519
Percentage of total enrollment
Amer Indian/Alaskan: 0.7%
Asian/Pacific Islander: 23.9%
Black: 9.8%
Hispanic: 7.4%
Two or more races: 1.8%
White: 56.3%

Prev
Next
#43 Foxborough Regional
Foxborough Reg. Charter HS, Foxborough, MA
Total enrollment: 1,265
Percentage of total enrollment
Amer Indian/Alaskan: 0.0%
Asian/Pacific Islander: 10.4%
Black: 23.8%
Hispanic: 5.1%
Two or more races: 4.5%
White: 56.3%

Prev
Next
#42 Boston Collegiate
Boston Collegiate Charter HS, Dorchester, MA
Total enrollment: 632
Percentage of total enrollment
Amer Indian/Alaskan: 0.3%
Asian/Pacific Islander: 1.9%
Black: 25.5%
Hispanic: 15.7%
Two or more races: 2.2%
White: 54.4%

Prev
Next
#41 Full Circle HS
Somerville, MA
Total enrollment: 56
Percentage of total enrollment
Amer Indian/Alaskan: 0.0%
Asian/Pacific Islander: 1.8%
Black: 21.4%
Hispanic: 35.7%
Two or more races: 1.8%
White: 39.3%

Prev
Next
#40 Waltham Senior HS
Waltham, MA
Total enrollment: 1,389
Percentage of total enrollment
Amer Indian/Alaskan: 0.1%
Asian/Pacific Islander: 6.4%
Black: 11.2%
Hispanic: 30.6%
Two or more races: 2.6%
White: 49.1%

Prev
Next
#39 Medford HS
Medford MA
Total enrollment: 1,155
Percentage of total enrollment
Amer Indian/Alaskan: 0.3%
Asian/Pacific Islander: 10.0%
Black: 18.4%
Hispanic: 8.2%
Two or more races: 1.9%
White: 61.9%

Prev
Next
#38 Snowden International
Snowden Int'l School at Copley, Boston, MA
Total enrollment: 397
Percentage of total enrollment
Amer Indian/Alaskan: 0.3%
Asian/Pacific Islander: 7.6%
Black: 38.3%
Hispanic: 41.3%
Two or more races: 3.0%
White: 9.6%

Prev
Next
#37 Brockton HS
Brockton Champion HS, Brockton, MA
Total enrollment: 194
Percentage of total enrollment
Amer Indian/Alaskan: 0.5%
Asian/Pacific Islander: 1.0%
Black: 41.2%
Hispanic: 19.6%
Two or more races: 2.6%
White: 35.1%

Prev
Next
#36 Worcester Tech. HS
Worcester, MA
Total enrollment: 1,358
Percentage of total enrollment
Amer Indian/Alaskan: 0.5%
Asian/Pacific Islander: 5.8%
Black: 12.4%
Hispanic: 34.6%
Two or more races: 2.2%
White: 44.5%

Prev
Next
#35 Acad. of the Pac. Rim
Acad. of the Pac. Rim Charter Public HS, Hyde Park MA
Total enrollment: 498
Percentage of total enrollment
Amer Indian/Alaskan: 0.0%
Asian/Pacific Islander: 1.4%
Black: 58.4%
Hispanic: 20.5%
Two or more races: 3.4%
White: 16.3%

Prev
Next
#34 Lynn Vocational
Lynn Vocational Tech. Institute, Lynn, MA
Total enrollment: 750
Percentage of total enrollment
Amer Indian/Alaskan: 0.8%
Asian/Pacific Islander: 6.7%
Black: 10.7%
Hispanic: 60.0%
Two or more races: 2.9%
White: 18.9%

Prev
Next
#33 Boston Arts Academy
Boston, MA
Total enrollment: 445
Percentage of total enrollment
Amer Indian/Alaskan: 0.4%
Asian/Pacific Islander: 3.1%
Black: 38.7%
Hispanic: 40.0%
Two or more races: 2.2%
White: 15.5%

Prev
Next
#32 Greater Lowell
Greater Lowell Reg. Vocational Tech., Tyngsborough, MA
Total enrollment: 2,112
Percentage of total enrollment
Amer Indian/Alaskan: 0.5%
Asian/Pacific Islander: 14.8%
Black: 3.9%
Hispanic: 26.6%
Two or more races: 2.6%
White: 51.7%
Prev
Next
#31 Amherst Regional HS
Amherst, MA
Total enrollment: 1,004
Percentage of total enrollment
Amer Indian/Alaskan: 0.1%
Asian/Pacific Islander: 10.0%
Black: 8.3%
Hispanic: 12.2%
Two or more races: 8.4%
White: 61.2%

Prev
Next
#30 Horace Mann
Horace Mann School for the Deaf, Allston, MA
Total enrollment: 111
Percentage of total enrollment
Amer Indian/Alaskan: 0.0%
Asian/Pacific Islander: 9.0%
Black: 36.0%
Hispanic: 41.4%
Two or more races: 1.8%
White: 11.7%

Prev
Next
#29 Everett HS
Everett, MA
Total enrollment: 2,004
Percentage of total enrollment
Amer Indian/Alaskan: 0.3%
Asian/Pacific Islander: 4.9%
Black: 23.9%
Hispanic: 32.4%
Two or more races: 1.0%
White: 37.5%

Prev
Next
#28 Lynn English HS
Lynn, MA
Total enrollment: 1,611
Percentage of total enrollment
Amer Indian/Alaskan: 0.1%
Asian/Pacific Islander: 9.9%
Black: 10.8%
Hispanic: 53.0%
Two or more races: 2.2%
White: 24.0%
Prev
Next
#27 Boston Latin HS
Boston, MA
Total enrollment: 2,379
Percentage of total enrollment
Amer Indian/Alaskan: 0.0%
Asian/Pacific Islander: 29.1%
Black: 9.5%
Hispanic: 10.6%
Two or more races: 3.1%
White: 47.7%
Prev
Next
#26 Prospect Hill
Prospect Hill Academy Charter HS, Cambridge, MA
Total enrollment: 1,148
Percentage of total enrollment
Amer Indian/Alaskan: 0.3%
Asian/Pacific Islander: 6.9%
Black: 57.2%
Hispanic: 19.6%
Two or more races: 3.0%
White: 13.0%

Prev
Next
#25 Brookline HS
Brookline, MA
Total enrollment: 1,832
Percentage of total enrollment
Amer Indian/Alaskan: 0.0%
Asian/Pacific Islander: 14.8%
Black: 7.9%
Hispanic: 10.3%
Two or more races: 7.0%
White: 60.0%

Prev
Next
#24 New Bedford HS
New Bedford, MA
Total enrollment: 2,436
Percentage of total enrollment
Amer Indian/Alaskan: 0.8%
Asian/Pacific Islander: 1.7%
Black: 14.8%
Hispanic: 31.1%
Two or more races: 6.5%
White: 45.0%

Prev
Next
#23 Randolph HS
New Bedford, MA
Total enrollment: 746
Percentage of total enrollment
Amer Indian/Alaskan: 0.5%
Asian/Pacific Islander: 17.4%
Black: 58.7%
Hispanic: 9.0%
Two or more races: 1.6%
White: 12.7%

Prev
Next
#22 Charlestown HS
Charlestown, MA
Total enrollment: 935
Percentage of total enrollment
Amer Indian/Alaskan: 0.4%
Asian/Pacific Islander: 20.2%
Black: 41.9%
Hispanic: 30.4%
Two or more races: 0.9%
White: 6.2%

Prev
Next
#21 Burncoat Senior HS
Worcester, MA
Total enrollment: 996
Percentage of total enrollment
Amer Indian/Alaskan: 0.4%
Asian/Pacific Islander: 5.1%
Black: 17.1%
Hispanic: 39.8%
Two or more races: 2.1%
White: 35.5%

Prev
Next
#20 Springfield Ren.
Springfield Renaissance School, Springfield, MA
Total enrollment: 705
Percentage of total enrollment
Amer Indian/Alaskan: 0.1%
Asian/Pacific Islander: 1.4%
Black: 25.5%
Hispanic: 42.6%
Two or more races: 6.1%
White: 24.3%

Prev
Next
#19 Sabis International
Sabis Int'l Charter School, Springfield, MA
Total enrollment: 1,574
Percentage of total enrollment
Amer Indian/Alaskan: 0.0%
Asian/Pacific Islander: 2.8%
Black: 30.1%
Hispanic: 33.2%
Two or more races: 5.2%
White: 28.2%

Prev
Next
#18 Quincy Upper HS
Boston, MA
Total enrollment: 487
Percentage of total enrollment
Amer Indian/Alaskan: 0.0%
Asian/Pacific Islander: 53.2%
Black: 20.7%
Hispanic: 16.8%
Two or more races: 2.3%
White: 7.0%

Prev
Next
#17 Springfield Central HS
Springfield, MA
Total enrollment: 2,086
Percentage of total enrollment
Amer Indian/Alaskan: 0.0%
Asian/Pacific Islander: 6.6%
Black: 24.1%
Hispanic: 49.8%
Two or more races: 3.7%
White: 15.7%
Prev
Next
#16 Mystic Valley
Mystic Valley Reg. Charter HS, Malden, MA
Total enrollment: 1,499
Percentage of total enrollment
Amer Indian/Alaskan: 0.1%
Asian/Pacific Islander: 16.0%
Black: 16.6%
Hispanic: 6.2%
Two or more races: 3.9%
White: 57.2%

Prev
Next
#15 Univ. Park Campus
University Park Campus HS, Worcester, MA
Total enrollment: 230
Percentage of total enrollment
Amer Indian/Alaskan: 0.0%
Asian/Pacific Islander: 23.9%
Black: 7.4%
Hispanic: 49.3%
Two or more races: 2.2%
White: 18.3%

Prev
Next
#14 Doherty Mem. HS
Worcester, MA
Total enrollment: 1,337
Percentage of total enrollment
Amer Indian/Alaskan: 0.6%
Asian/Pacific Islander: 9.3%
Black: 14.1%
Hispanic: 30.3%
Two or more races: 2.2%
White: 43.4%

Prev
Next
#13 North HS
Worcester, MA
Total enrollment: 1,295
Percentage of total enrollment
Amer Indian/Alaskan: 0.2%
Asian/Pacific Islander: 8.3%
Black: 19.2%
Hispanic: 46.4%
Two or more races: 1.7%
White: 24.2%

Prev
Next
#12 Lowell HS
Lowell, MA
Total enrollment: 3,054
Percentage of total enrollment
Amer Indian/Alaskan: 0.1%
Asian/Pacific Islander: 32.5%
Black: 9.7%
Hispanic: 24.1%
Two or more races: 1.1%
White: 32.4%

Prev
Next
#11 Whaling City Alt.
Whaling City Alternative HS, New Bedford, MA
Total enrollment: 99
Percentage of total enrollment
Amer Indian/Alaskan: 2.0%
Asian/Pacific Islander: 1.0%
Black: 20.2%
Hispanic: 37.4%
Two or more races: 8.1%
White: 31.4%

Prev
Next
#10 Somerville HS
Somerville, MA
Total enrollment: 1,265
Percentage of total enrollment
Amer Indian/Alaskan: 0.2%
Asian/Pacific Islander: 11.6%
Black: 15.3%
Hispanic: 39.8%
Two or more races: 0.9%
White: 32.3%

Prev
Next
#9 Pioneer Charter
Pioneer Charter School of Science, Everett, MA
Total enrollment: 359
Percentage of total enrollment
Amer Indian/Alaskan: 2.5%
Asian/Pacific Islander: 8.7%
Black: 37.0%
Hispanic: 17.8%
Two or more races: 0.6%
White: 33.4%

Prev
Next
#8 Lynn Classical HS
Lynn, MA
Total enrollment: 1,498
Percentage of total enrollment
Amer Indian/Alaskan: 0.1%
Asian/Pacific Islander: 11.8%
Black: 14.3%
Hispanic: 45.6%
Two or more races: 2.7%
White: 25.4%

Prev
Next
#7 Cambridge Rindge
Cambridge Rindge and Latin, Cambridge, MA
Total enrollment: 1,741
Percentage of total enrollment
Amer Indian/Alaskan: 0.6%
Asian/Pacific Islander: 11.8%
Black: 33.2%
Hispanic: 14.0%
Two or more races: 3.0%
White: 37.5%

Prev
Next
#6 Fecteau-Leary
Fecteau-Leary Junior/Senior HS, Lynn, MA
Total enrollment: 157
Percentage of total enrollment
Amer Indian/Alaskan: 0.6%
Asian/Pacific Islander: 8.3%
Black: 19.7%
Hispanic: 43.3%
Two or more races: 3.8%
White: 24.2%

Prev
Next
#5 O'Bryant HS
Roxbury, MA
Total enrollment: 1,353
Percentage of total enrollment
Amer Indian/Alaskan: 0.1%
Asian/Pacific Islander: 21.3%
Black: 37.2%
Hispanic: 28.6%
Two or more races: 1.6%
White: 11.1%

Prev
Next
#4 Excel HS
South Boston, MA
Total enrollment: 550
Percentage of total enrollment
Amer Indian/Alaskan: 0.5%
Asian/Pacific Islander: 22.5%
Black: 38.4%
Hispanic: 23.3%
Two or more races: 1.6%
White: 13.6%

Prev
Next
#3 South HS
Worcester, MA
Total enrollment: 1,264
Percentage of total enrollment
Amer Indian/Alaskan: 0.6%
Asian/Pacific Islander: 14.9%
Black: 19.6%
Hispanic: 39.2%
Two or more races: 1.7%
White: 24.1%

Prev
Next
#2 Boston Latin Acad.
Dorchester, MA
Total enrollment: 1,689
Percentage of total enrollment
Amer Indian/Alaskan: 0.7%
Asian/Pacific Islander: 21.6%
Black: 27.1%
Hispanic: 20.7%
Two or more races: 1.8%
White: 28.2%

Prev
Next
#1 Malden HS
Malden, MA
Total enrollment: 1,835
Percentage of total enrollment
Amer Indian/Alaskan: 0.7%
Asian/Pacific Islander: 24.9%
Black: 22.6%
Hispanic: 19.9%
Two or more races: 3.7%
White: 28.3%
Enjoy this post? Share it with others.
Email to a friend
Permalink


 Delivered Free Every
Follow us on Pinterest Google + Facebook Twitter See It Read It