Is Racial Deisolation Costing Worcester Millions in School Transportation?


 Email to a friend
Permalink
Email to a friend
Permalink
Saturday, January 03, 2015
Patrick Sargent, GoLocal Worcester Contributor
According to a
report by the Worcester Research Bureau, the city of Worcester spent more than $15 million in public school transportation costs in Fiscal Year 2013. This amount represents a combination of regular bussing costs, special education bussing, mandated McKinney-Vento transportation and salaries of employees responsible for conducting bus transportation.
There are two factors that are contributing to the city's high transportation costs. The first is racial deisolation which requires that all of the Worcester schools reflect the minority-majority population of the community within 15% percent of the minority-majority ratio in Worcester. This means that if there is a school in Worcester with much more minority students than majority or much more majority students than minority than the student population of the city reflects, the city has to take steps to balance the schools populations.
“A lot of our transportation now is to bring students from one part of the city into another to create that ratio of ethnic balance. For instance if a school is 75% majority, then we bring minorities in from another part of the city to create a balance. So that’s a big transportation expense," said Worcester School Committee member Brian O'Connell.
How did Worcester get Involved with a Deisolation Plan?
Worcester Public Schools agreed to the racial deisolation plan in the early 1990s. It’s a contractual obligation to the state of Massachusetts for the approval of preferential funding for new school construction and renovation.
“It was our means of getting our schools to the top of the list for state support and having those schools funded at a very high percentage of the overall cost," said O'Connell. "We’ve benefited in a number of ways. We got a lot more schools approved that wouldn’t have been had we not had that plan in place."
At the next school committee meeting, the current demographic trends in Worcester will be addressed in terms of the racial de-isolation plan that the city must follow. According to the School Committee rules, "The School Committee shall conduct a public hearing relative to the Minority Deisolation Plan at its first meeting in December each year. At the hearing, the School Committee will review the results concerning the implementation of the plan and will make the necessary changes in an effort to maintain the correct minority/majority percent at each school. The School Committee will vote the revised plans for the schools that require changes and any other amendments necessary prior to the opening of school."
"We've certainly gotten very generous state support in key areas especially in building construction and building renovation. The state approved our plans and then put us on top of the list. That brought us multi-millions of dollars for school construction that we never would have had the opportunity to receive or spend if we had to wait our turn beneath so many other school systems around the state," said O'Connell.
Safety is a Factor
The second factor of high transportation costs is that the city transports a lot of children by the school system’s choice, as opposed to by legal requirement. The school system could choose not to transport children that live within walking distance of their schools. However, children are offered transportation for safety reasons.
"With the lack of sidewalks in Worcester, and congested and high traffic roadways in the city, we provide transportation based on safety, as opposed to legal requirements," said O'Connell. "We could eliminate a lot of transportation if we chose, and a lot of transportation at the secondary level if we chose, by law we have the right to do that, but the real concern is that if we did that, we would put the children’s safety in jeopardy, and we would end up encouraging students to drop out of school, especially at the high school level.”
What About Neighborhood Schools?
As Worcester was signing on with the state for its racial deisolation plan, the city of Boston was beginning a pilot program of more than 20 public schools. Of these schools, some of them have become "neighborhood" schools and have eliminated transportation completely. Freeing up these funds has allowed school administrators the autonomy to disperse money where they see fit and into programs that the school needs.
O’Connell said, “Perhaps we can focus on more neighborhood schools, or more innovation schools and if the determination can be made for more focus on programs to diverse within our immediate neighborhood, as opposed to an ethnic balance in schools right across the entire city, we could potentially have more varied programs in the schools, attracting students from their neighborhood, without having to bus students from one part of Worcester all the way to another. That would cut back on transportation expenses and would enable more students to walk to school.”
Related Slideshow: The 50 Least Diverse High Schools in Massachusetts
Prev
Next
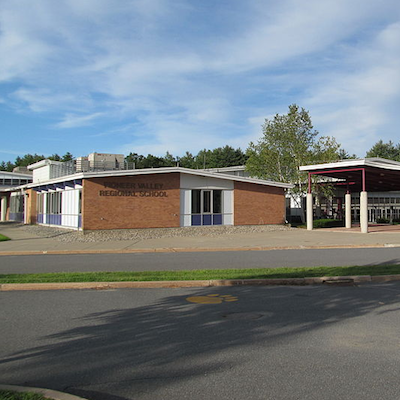
#50 Pioneer Valley Reg.
Northfield, MA
Total enrollment: 500
Percentage of total enrollment
Amer Indian/Alaskan: 0.9%
Asian/Pacific Islander: 1.6%
Black: 1.0%
Hispanic: 2.4%
Two or more races: 1.0%
White: 93.2%

Prev
Next
#49 Health & Human Svc.
Health & Human Svc. HS, Lawrence, MA
Total enrollment: 520
Percentage of total enrollment
Amer Indian/Alaskan: 0.0%
Asian/Pacific Islander: 0.6%
Black: 2.5%
Hispanic: 93.3%
Two or more races: 0.2%
White: 3.5%

Prev
Next
#48 South Shore HS
South Shore Voc. Tech. HS, Hanover, MA
Total enrollment: 600
Percentage of total enrollment
Amer Indian/Alaskan: 0.0%
Asian/Pacific Islander: 0.0%
Black: 2.8%
Hispanic: 2.7%
Two or more races: 1.2%
White: 93.3%

Prev
Next
#47 Seekonk HS
Seekonk, MA
Total enrollment: 628
Percentage of total enrollment
Amer Indian/Alaskan: 0.0%
Asian/Pacific Islander: 2.7%
Black: 0.8%
Hispanic: 2.4%
Two or more races: 0.8%
White: 93.3%

Prev
Next
#46 Athol HS
Athol, MA
Total enrollment: 378
Percentage of total enrollment
Amer Indian/Alaskan: 0.0%
Asian/Pacific Islander: 0.0%
Black: 1.9%
Hispanic: 2.9%
Two or more races: 1.9%
White: 93.4%

Prev
Next
#45 Humanities & Leadership
Humanities & Leadership Dev. HS, Lawrence, MA
Total enrollment: 521
Percentage of total enrollment
Amer Indian/Alaskan: 0.0%
Asian/Pacific Islander: 1.7%
Black: 1.9%
Hispanic: 93.5%
Two or more races: 0.0%
White: 2.9%

Prev
Next
#44 Blackstone Valley
Blackstone Valley Reg. Voc. Tech., Upton, MA
Total enrollment: 1,164
Percentage of total enrollment
Amer Indian/Alaskan: 0.0%
Asian/Pacific Islander: 0.8%
Black: 0.8%
Hispanic: 2.8%
Two or more races: 2.1%
White: 93.5%

Prev
Next
#43 Hopedale Jr. Sr. HS
Hopedale, MA
Total enrollment: 548
Percentage of total enrollment
Amer Indian/Alaskan: 0.5%
Asian/Pacific Islander: 1.6%
Black: 0.5%
Hispanic: 2.6%
Two or more races: 1.1%
White: 93.6%

Prev
Next
#42 Wahconah Reg. HS
Dalton, MA
Total enrollment: 563
Percentage of total enrollment
Amer Indian/Alaskan: 0.0%
Asian/Pacific Islander: 0.7%
Black: 0.9%
Hispanic: 2.0%
Two or more races: 2.7%
White: 93.8%

Prev
Next
#41 W. Wareham Academy
Wareham, MA
Total enrollment: 16
Percentage of total enrollment
Amer Indian/Alaskan: 0.0%
Asian/Pacific Islander: 0.0%
Black: 0.0%
Hispanic: 0.0%
Two or more races: 6.2%
White: 93.8%

Prev
Next
#40 Sutton HS
Sutton, MA
Total enrollment: 418
Percentage of total enrollment
Amer Indian/Alaskan: 0.0%
Asian/Pacific Islander: 0.2%
Black: 0.5%
Hispanic: 1.7%
Two or more races: 3.8%
White: 93.8%

Prev
Next
#39 Bay Path HS
Bay Path Reg. Voc. Tech. HS, Charlton, MA
Total enrollment: 1,104
Percentage of total enrollment
Amer Indian/Alaskan: 0.1%
Asian/Pacific Islander: 0.5%
Black: 0.4%
Hispanic: 4.9%
Two or more races: 0.3%
White: 93.9%

Prev
Next
#38 HS Learning Center
Lawrence, MA
Total enrollment: 167
Percentage of total enrollment
Amer Indian/Alaskan: 0.0%
Asian/Pacific Islander: 1.8%
Black: 1.8%
Hispanic: 94.0%
Two or more races: 0.0%
White: 2.4%

Prev
Next
#37 Shawsheen Valley
Shawsheen Valley Vocational Tech., Billerica, MA
Total enrollment: 1,372
Percentage of total enrollment
Amer Indian/Alaskan: 0.2%
Asian/Pacific Islander: 0.4%
Black: 0.8%
Hispanic: 3.0%
Two or more races: 1.5%
White: 94.1%

Prev
Next
#36 Nipmuc Reg. HS
Upton, MA
Total enrollment: 667
Percentage of total enrollment
Amer Indian/Alaskan: 0.1%
Asian/Pacific Islander: 1.4%
Black: 1.2%
Hispanic: 2.4%
Two or more races: 0.7%
White: 94.0%

Prev
Next
#35 Tewksbury Memorial HS
Tewksbury, MA
Total enrollment: 985
Percentage of total enrollment
Amer Indian/Alaskan: 0.1%
Asian/Pacific Islander: 2.6%
Black: 1.3%
Hispanic: 1.8%
Two or more races: 0.0%
White: 94.1%

Prev
Next
#34 N. Reading HS
North Reading, MA
Total enrollment: 755
Percentage of total enrollment
Amer Indian/Alaskan: 0.0%
Asian/Pacific Islander: 1.9%
Black: 0.5%
Hispanic: 2.0%
Two or more races: 1.5%
White: 94.2%

Prev
Next
#33 Joseph Case HS
Swansea, MA
Total enrollment: 551
Percentage of total enrollment
Amer Indian/Alaskan: 0.2%
Asian/Pacific Islander: 0.9%
Black: 2.0%
Hispanic: 0.9%
Two or more races: 1.6%
White: 94.4%

Prev
Next
#32 Gardner Academy
Gardner Academy for Learning and Tech., Gardner, MA
Total enrollment: 91
Percentage of total enrollment
Amer Indian/Alaskan: 0.0%
Asian/Pacific Islander: 1.1%
Black: 0.0%
Hispanic: 2.2%
Two or more races: 2.2%
White: 94.5%
Prev
Next
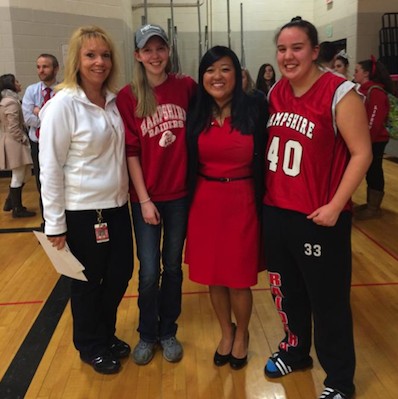
#31 Hampshire Reg. HS
Westhampton, MA
Total enrollment: 756
Percentage of total enrollment
Amer Indian/Alaskan: 0.0%
Asian/Pacific Islander: 0.4%
Black: 0.5%
Hispanic: 2.8%
Two or more races: 1.6%
White: 94.7%

Prev
Next
#30 Triton Reg. HS
Byfield, MA
Total enrollment: 738
Percentage of total enrollment
Amer Indian/Alaskan: 0.0%
Asian/Pacific Islander: 1.2%
Black: 0.5%
Hispanic: 2.7%
Two or more races: 0.8%
White: 94.7%

Prev
Next
#29 Medway HS
Medway, MA
Total enrollment: 779
Percentage of total enrollment
Amer Indian/Alaskan: 0.3%
Asian/Pacific Islander: 1.9%
Black: 0.5%
Hispanic: 1.9%
Two or more races: 0.6%
White: 94.7%

Prev
Next
#28 Apponequet Reg. HS
Lakeville, MA
Total enrollment: 813
Percentage of total enrollment
Amer Indian/Alaskan: 0.2%
Asian/Pacific Islander: 1.1%
Black: 0.6%
Hispanic: 1.5%
Two or more races: 1.8%
White: 94.7%

Prev
Next
#27 Pentucket HS
Pentucket Regional Sen. HS, West Newbury, MA
Total enrollment: 785
Percentage of total enrollment
Amer Indian/Alaskan: 0.0%
Asian/Pacific Islander: 1.4%
Black: 0.4%
Hispanic: 1.9%
Two or more races: 1.5%
White: 94.8%

Prev
Next
#26 Gateway Reg. HS
Huntington, MA
Total enrollment: 282
Percentage of total enrollment
Amer Indian/Alaskan: 0.0%
Asian/Pacific Islander: 0.7%
Black: 0.4%
Hispanic: 2.8%
Two or more races: 1.1%
White: 95.0%

Prev
Next
#25 N. Middlesex Reg. HS
Townsend, MA
Total enrollment: 956
Percentage of total enrollment
Amer Indian/Alaskan: 0.1%
Asian/Pacific Islander: 1.5%
Black: 0.8%
Hispanic: 1.7%
Two or more races: 0.8%
White: 95.1%

Prev
Next
#24 Scituate HS
Scituate, MA
Total enrollment: 947
Percentage of total enrollment
Amer Indian/Alaskan: 0.0%
Asian/Pacific Islander: 0.9%
Black: 2.2%
Hispanic: 0.4%
Two or more races: 1.3%
White: 95.1%
Prev
Next
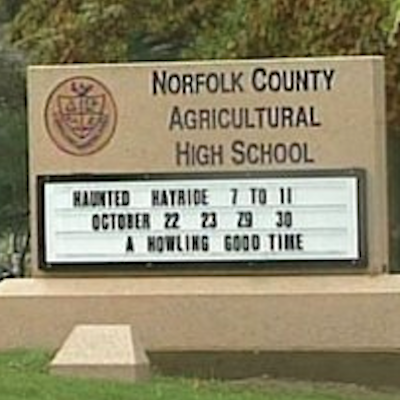
#23 Norfolk County HS
Norfolk County Agricultural HS, Walpole, MA
Total enrollment: 476
Percentage of total enrollment
Amer Indian/Alaskan: 0.0%
Asian/Pacific Islander: 1.1%
Black: 1.1%
Hispanic: 1.5%
Two or more races: 1.1%
White: 95.4%

Prev
Next
#22 Masconomet Reg. HS
Topsfield, MA
Total enrollment: 1,382
Percentage of total enrollment
Amer Indian/Alaskan: 0.1%
Asian/Pacific Islander: 2.2%
Black: 0.4%
Hispanic: 1.7%
Two or more races: 0.1%
White: 95.4%
Prev
Next
#21 King Phillip Reg. HS
Wrentham, MA
Total enrollment: 1,322
Percentage of total enrollment
Amer Indian/Alaskan: 0.3%
Asian/Pacific Islander: 1.1%
Black: 0.8%
Hispanic: 0.7%
Two or more races: 1.4%
White: 95.8%

Prev
Next
#20 Norwell HS
Norwell, MA
Total enrollment: 677
Percentage of total enrollment
Amer Indian/Alaskan: 1.2%
Asian/Pacific Islander: 0.4%
Black: 0.1%
Hispanic: 2.1%
Two or more races: 0.6%
White: 96.0%

Prev
Next
#19 Norton HS
Norton, MA
Total enrollment: 715
Percentage of total enrollment
Amer Indian/Alaskan: 0.0%
Asian/Pacific Islander: 1.6%
Black: 1.1%
Hispanic: 0.8%
Two or more races: 0.3%
White: 95.4%

Prev
Next
#18 Charles McCann
Charles McCann Voc. Tech., North Adams, MA
Total enrollment: 505
Percentage of total enrollment
Amer Indian/Alaskan: 0.0%
Asian/Pacific Islander: 0.4%
Black: 1.0%
Hispanic: 2.0%
Two or more races: 0.8%
White: 95.8%
Prev
Next
#17 Westfield Vocational
Westfield Vocational Tech. HS, Westfield, MA
Total enrollment: 470
Percentage of total enrollment
Amer Indian/Alaskan: 0.0%
Asian/Pacific Islander: 1.5%
Black: 1.5%
Hispanic: 0.6%
Two or more races: 0.4%
White: 96.0%

Prev
Next
#16 Medfield Senior High
Medfield, MA
Total enrollment: 882
Percentage of total enrollment
Amer Indian/Alaskan: 0.0%
Asian/Pacific Islander: 3.3%
Black: 0.3%
Hispanic: 1.6%
Two or more races: 1.5%
White: 93.3%

Prev
Next
#15 Georgetown MS/HS
Georgetown, MA
Total enrollment: 407
Percentage of total enrollment
Amer Indian/Alaskan: 0.0%
Asian/Pacific Islander: 1.0%
Black: 0.0%
Hispanic: 1.2%
Two or more races: 1.5%
White: 96.3%

Prev
Next
#14 Hanover HS
Hanover, MA
Total enrollment: 778
Percentage of total enrollment
Amer Indian/Alaskan: 0.0%
Asian/Pacific Islander: 1.2%
Black: 1.2%
Hispanic: 1.0%
Two or more races: 0.3%
White: 96.4%

Prev
Next
#13 Carver MS/HS
Carver, MA
Total enrollment: 870
Percentage of total enrollment
Amer Indian/Alaskan: 0.2%
Asian/Pacific Islander: 0.1%
Black: 2.3%
Hispanic: 0.3%
Two or more races: 0.7%
White: 96.3%

Prev
Next
#12 Duxbury HS
Duxbury, MA
Total enrollment: 1,037
Percentage of total enrollment
Amer Indian/Alaskan: 0.2%
Asian/Pacific Islander: 1.1%
Black: 0.3%
Hispanic: 0.8%
Two or more races: 1.2%
White: 96.5%

Prev
Next
#11 Westport HS
Westport, MA
Total enrollment: 381
Percentage of total enrollment
Amer Indian/Alaskan: 0.0%
Asian/Pacific Islander: 0.3%
Black: 0.5%
Hispanic: 2.4%
Two or more races: 0.0%
White: 96.9%

Prev
Next
#10 Pembroke HS
Pembroke, MA
Total enrollment: 984
Percentage of total enrollment
Amer Indian/Alaskan: 0.0%
Asian/Pacific Islander: 0.8%
Black: 1.2%
Hispanic: 1.0%
Two or more races: 0.1%
White: 96.8%

Prev
Next
#9 Marshfield HS
Marshfield, MA
Total enrollment: 1,304
Percentage of total enrollment
Amer Indian/Alaskan: 0.1%
Asian/Pacific Islander: 0.6%
Black: 0.2%
Hispanic: 1.8%
Two or more races: 0.5%
White: 96.9%

Prev
Next
#8 Franklin County Tech.
Turners Falls, MA
Total enrollment: 523
Percentage of total enrollment
Amer Indian/Alaskan: 0.2%
Asian/Pacific Islander: 0.6%
Black: 0.0%
Hispanic: 1.0%
Two or more races: 1.3%
White: 96.9%

Prev
Next
#7 Sandwich HS
Sandwich, MA
Total enrollment: 786
Percentage of total enrollment
Amer Indian/Alaskan: 0.1%
Asian/Pacific Islander: 1.8%
Black: 1.1%
Hispanic: 0.0%
Two or more races: 0.0%
White: 96.9%
Prev
Next
#6 Silver Lake Reg. HS
Kingston, MA
Total enrollment: 1,274
Percentage of total enrollment
Amer Indian/Alaskan: 0.1%
Asian/Pacific Islander: 0.7%
Black: 1.5%
Hispanic: 0.2%
Two or more races: 0.2%
White: 97.4%

Prev
Next
#5 Douglas HS
Douglas, MA
Total enrollment: 573
Percentage of total enrollment
Amer Indian/Alaskan: 0.0%
Asian/Pacific Islander: 0.5%
Black: 0.0%
Hispanic: 1.6%
Two or more races: 0.5%
White: 97.4%
Prev
Next
#4 Old Colony Vocational
Old Colony Reg. Vocational Tech., Rochester, MA
Total enrollment: 579
Percentage of total enrollment
Amer Indian/Alaskan: 0.0%
Asian/Pacific Islander: 0.0%
Black: 0.3%
Hispanic: 0.5%
Two or more races: 1.0%
White: 98.1%

Prev
Next
#3 International HS
Lawrence, MA
Total enrollment: 521
Percentage of total enrollment
Amer Indian/Alaskan: 0.0%
Asian/Pacific Islander: 0.6%
Black: 0.2%
Hispanic: 98.5%
Two or more races: 0.0%
White: 0.8%
Prev
Next
#2 Tahanto Regional HS
Boylston, MA
Total enrollment: 542
Percentage of total enrollment
Amer Indian/Alaskan: 0.0%
Asian/Pacific Islander: 0.2%
Black: 0.6%
Hispanic: 0.0%
Two or more races: 0.2%
White: 99.1%

Prev
Next
#1 Manchester Essex HS
Manchester Essex Regional HS, Manchester, MA
Total enrollment: 461
Percentage of total enrollment
Amer Indian/Alaskan: 0.0%
Asian/Pacific Islander: 0.0%
Black: 0.4%
Hispanic: 0.0%
Two or more races: 0.2%
White: 99.3%
Related Articles
Enjoy this post? Share it with others.
Email to a friend
Permalink


 Delivered Free Every
Follow us on Pinterest Google + Facebook Twitter See It Read It