John Monfredo: Have You Considered Becoming a School Council Member?


 Email to a friend
Permalink
Email to a friend
Permalink
Saturday, October 04, 2014
John Monfredo, GoLocalWorcester MINDSETTER™
As schools complete their first month, the parents and the staff need to review the role of School Councils. The most effective schools are the ones that invite parents to become partners in the planning and development. Both groups need to work together to make certain that a quality education is taking place and that parents are part of the learning process. Just as parents are important to their children’s success in school, schools also do better when parents are fully respected and engaged as partners with schools.
Thus, the Worcester Educational Collaborative led by Dr. Jennifer Davis Carey in partnership with the Worcester City-wide Parent School Council organization held a workshop for parents to assist them as they start their site councils at their respective schools.
The parents were reminded that the law requires that there be a school council at each public elementary, secondary and independent vocational school in the Commonwealth. The law outlines four major areas of responsibility for councils. School councils are to assist principals in the following:
-
Adopting educational goals for the school that are consistent with local educational policies and statewide student performance standards
-
Identifying the educational needs of students attending the school
-
Reviewing the annual school building budget
-
Formulating a school improvement plan
All four are essential but the most important, perhaps, is the school improvement plan. Parents do have the opportunity to review and give their input into the plan and should also evaluate the results throughout the school year. In developing the School Improvement Plan, parents can have an important impact by making sure that issues to them and their children are addressed. Areas of interest might include:
-
Class size, its impact on student learning and a plan to reduce class size
-
Training to help school staff work effectively with families
-
Designing and implementing parent/family involvement activities
-
Providing information, training and materials to help families support their children’s education at home
-
Establishing a welcoming school environment at their school
-
Bullying
-
School Climate and discipline
-
College and career readiness
-
Hosting parent workshops
Obviously, improving student performance has to be the highest priority. School Councils become effective when parents are empowered and encouraged to assist in making decisions and are active members.
Keep in mind that school councils are advisory, but they are an influential working group to inform the principal, school district, and the school committee as to the needs of their school. Parents should be involved in civic engagement and be part of the learning process.
The legislation specifies that the council is to consist of parents of students attending the school, teachers, and other persons drawn from such groups or entities as municipal government, business and labor organizations, institutions of higher education, human service agencies or other interested groups, including those from school-age child care programs. Also, for schools containing any of grades nine to twelve, there should be at least one student on the council.
The law leaves it up to each principal to define the size and composition of the council. It is also important that the principal send out an invitation to parents to participate in the School Site Council and explain the role of the council. There are three conditions about membership:
-
Parents “shall have parity with professional personnel on the school councils.” Regardless of the size of the council, the number of parent representatives must be equal to the number of teachers who serve on the council plus the principal.
-
“Not more than fifty percent of the council shall be non-school members.” “Non-school members” are defined as members who are “other than parents, teachers, students and staff at the school.”
-
The membership of the school councils “should be broadly representative of the racial and ethnic diversity of the school building and the community.”
Parents should make their voice heard if they would like to be on the School Council for the law provides local leeway in the election process. It does, however, affirm the principle of peer selection:
-
Parent members are to be selected by the parents of students attending the school, in elections held by the local recognized parent-teacher organization or parent group.
-
Teacher members are to be selected by the teachers in the school. However, in most schools teachers either volunteer or are asked by the principal to be part of the School Council.
-
The process needs to be fair, open and without the influence of the school committee, superintendent or principal.
All meetings are subject to the provisions of the Massachusetts Open Meeting Law, which requires councils to:
-
Hold all meetings in public and allow anyone in attendance to audio and /or video tape the proceedings as long as it is not disruptive to the meeting.
-
Post a notice of each meeting with the city clerk and in a public place at least 48 hours prior to the meeting.
-
Keep minutes in dictating the date, time, and place members present and absent and actions taken.
-
Adhere to a quorum, which is to define as a majority of the council members.
The roles of the school site council member are many but most importantly they must be prepared to discuss the topics on the agenda and be open to other points of view. In addition, I believe it’s important that parent members report back to the Parent Group or PTO about what actions have taken place at the Site Council Meetings.
There are many other facets to the law and you can go on line and read more. In the meantime, consider being a member of the site council for you can play an important role in shaping the education at your child’s school and become an informed parent.
Related Slideshow: Central MA High Schools—2014 Rankings
Add link to methodology post.
Prev
Next
#59 Tantasqua Regional Vocational
Fiskdale, MA
2014 Overall MA Rank: #328
Enrollment (2010–2011): 460
Testing
Proficient or Higher ENGLISH LANGUAGE ARTS (ELA) 2011: 93%
Proficient or Higher MATH 2011: 72%
Proficient or Higher SCIENCE 2011: 54%
Average Total SAT Score: 1453
2014 performance at a glance
Student to Teacher Ratio (2010–2011): 38.1
4-Year Graduation Rates (2010): 89.3%
Spending per Student (2009–2010, by District): $12,985

Prev
Next
#58 North High
Worcester, MA
2014 Overall MA Rank: #321
Enrollment (2010–2011): 1295
Testing
Proficient or Higher ENGLISH LANGUAGE ARTS (ELA) 2011: 71%
Proficient or Higher MATH 2011: 48%
Proficient or Higher SCIENCE 2011: 34%
Average Total SAT Score: 1272
2014 performance at a glance
Student to Teacher Ratio (2010–2011): 17.9
4-Year Graduation Rates (2010): 65.2%
Spending per Student (2009–2010, by District): $13,489

Prev
Next
#57 Southbridge High
Southbridge, MA
2014 Overall MA Rank: #315
Enrollment (2010–2011): 472
Testing
Proficient or Higher ENGLISH LANGUAGE ARTS (ELA) 2011: 73%
Proficient or Higher MATH 2011: 46%
Proficient or Higher SCIENCE 2011: 45%
Average Total SAT Score: 1179
2014 performance at a glance
Student to Teacher Ratio (2010–2011): 13.8
4-Year Graduation Rates (2010): 84.4%
Spending per Student (2009–2010, by District): $12,894

Prev
Next
#56 Claremont Academy
Worcester, MA
2014 Overall MA Rank: #309
Enrollment (2010–2011): 267
Testing
Proficient or Higher ENGLISH LANGUAGE ARTS (ELA) 2011: 73%
Proficient or Higher MATH 2011: 45%
Proficient or Higher SCIENCE 2011: 27%
Average Total SAT Score: 1258
2014 performance at a glance
Student to Teacher Ratio (2010–2011): 12
4-Year Graduation Rates (2010): 72.5%
Spending per Student (2009–2010, by District): $13,489

Prev
Next
#55 South High Community
Worcester, MA
2014 Overall MA Rank: #306
Enrollment (2010–2011): 1264
Testing
Proficient or Higher ENGLISH LANGUAGE ARTS (ELA) 2011: 78%
Proficient or Higher MATH 2011: 56%
Proficient or Higher SCIENCE 2011: 44%
Average Total SAT Score: 1309
2014 performance at a glance
Student to Teacher Ratio (2010–2011): 15.2
4-Year Graduation Rates (2010): 64.7%
Spending per Student (2009–2010, by District): $13,489

Prev
Next
#54 Fitchburg High
Fitchburg, MA
2014 Overall MA Rank: #299
Enrollment (2010–2011): 1116
Testing
Proficient or Higher ENGLISH LANGUAGE ARTS (ELA) 2011: 83%
Proficient or Higher MATH 2011: 66%
Proficient or Higher SCIENCE 2011: 46%
Average Total SAT Score: 1294
2014 performance at a glance
Student to Teacher Ratio (2010–2011): 14.5
4-Year Graduation Rates (2010): 82.8%
Spending per Student (2009–2010, by District): $12,681

Prev
Next
#53 Burncoat Senior High
Worcester, MA
2014 Overall MA Rank: #295
Enrollment (2010–2011): 996
Testing
Proficient or Higher ENGLISH LANGUAGE ARTS (ELA) 2011: 78%
Proficient or Higher MATH 2011: 61%
Proficient or Higher SCIENCE 2011: 38%
Average Total SAT Score: 1340
2014 performance at a glance
Student to Teacher Ratio (2010–2011): 12.6
4-Year Graduation Rates (2010): 72.2%
Spending per Student (2009–2010, by District): $13,489

Prev
Next
#52 Ware Junior/Senior High School
Ware, MA
2014 Overall MA Rank: #277
Enrollment (2010–2011): 280
Testing
Proficient or Higher ENGLISH LANGUAGE ARTS (ELA) 2011: 86%
Proficient or Higher MATH 2011: 71%
Proficient or Higher SCIENCE 2011: 63%
Average Total SAT Score: 1429
2014 performance at a glance
Student to Teacher Ratio (2010–2011): 13.2
4-Year Graduation Rates (2010): 76.5%
Spending per Student (2009–2010, by District): $11,919

Prev
Next
#51 Doherty Memorial High
Worcester, MA
2014 Overall MA Rank: #275
Enrollment (2010–2011): 1337
Testing
Proficient or Higher ENGLISH LANGUAGE ARTS (ELA) 2011: 86%
Proficient or Higher MATH 2011: 71%
Proficient or Higher SCIENCE 2011: 62%
Average Total SAT Score: 1417
2014 performance at a glance
Student to Teacher Ratio (2010–2011): 14.8
4-Year Graduation Rates (2010): 83.2%
Spending per Student (2009–2010, by District): $13,489

Prev
Next
#50 Worcester Technical High
Worcester, MA
2014 Overall MA Rank: #271
Enrollment (2010–2011): 1358
Testing
Proficient or Higher ENGLISH LANGUAGE ARTS (ELA) 2011: 92%
Proficient or Higher MATH 2011: 84%
Proficient or Higher SCIENCE 2011: 59%
Average Total SAT Score: 1249
2014 performance at a glance
Student to Teacher Ratio (2010–2011): 11.8
4-Year Graduation Rates (2010): 95%
Spending per Student (2009–2010, by District): $13,489

Prev
Next
#49 Bartlett Jr Sr High School
Webster, MA
2014 Overall MA Rank: #270
Enrollment (2010–2011): 472
Testing
Proficient or Higher ENGLISH LANGUAGE ARTS (ELA) 2011: 93%
Proficient or Higher MATH 2011: 81%
Proficient or Higher SCIENCE 2011: 55%
Average Total SAT Score: 1387
2014 performance at a glance
Student to Teacher Ratio (2010–2011): 12.5
4-Year Graduation Rates (2010): 70%
Spending per Student (2009–2010, by District): $12,786

Prev
Next
#48 Murdock Middle/High
Winchendon, MA
2014 Overall MA Rank: #265
Enrollment (2010–2011): 325
Testing
Proficient or Higher ENGLISH LANGUAGE ARTS (ELA) 2011: 80%
Proficient or Higher MATH 2011: 60%
Proficient or Higher SCIENCE 2011: 52%
Average Total SAT Score: 1483
2014 performance at a glance
Student to Teacher Ratio (2010–2011): 11.7
4-Year Graduation Rates (2010): 91%
Spending per Student (2009–2010, by District): $12,737

Prev
Next
#47 David Prouty High
Spencer, MA
2014 Overall MA Rank: #262
Enrollment (2010–2011): 473
Testing
Proficient or Higher ENGLISH LANGUAGE ARTS (ELA) 2011: 90%
Proficient or Higher MATH 2011: 82%
Proficient or Higher SCIENCE 2011: 54%
Average Total SAT Score: 1468
2014 performance at a glance
Student to Teacher Ratio (2010–2011): 14.5
4-Year Graduation Rates (2010): 87.7%
Spending per Student (2009–2010, by District): $12,290

Prev
Next
#46 Athol-Royalston High
Athol, MA
2014 Overall MA Rank: #254
Enrollment (2010–2011): 378
Testing
Proficient or Higher ENGLISH LANGUAGE ARTS (ELA) 2011: 90%
Proficient or Higher MATH 2011: 72%
Proficient or Higher SCIENCE 2011: 76%
Average Total SAT Score: 1364
2014 performance at a glance
Student to Teacher Ratio (2010–2011): 11.9
4-Year Graduation Rates (2010): 81.9%
Spending per Student (2009–2010, by District): $13,679
Prev
Next
#45 Leominster Senior High
Leominster, MA
2014 Overall MA Rank: #253
Enrollment (2010–2011): 1105
Testing
Proficient or Higher ENGLISH LANGUAGE ARTS (ELA) 2011: 91%
Proficient or Higher MATH 2011: 74%
Proficient or Higher SCIENCE 2011: 82%
Average Total SAT Score: 1472
2014 performance at a glance
Student to Teacher Ratio (2010–2011): 15.6
4-Year Graduation Rates (2010): 90.4%
Spending per Student (2009–2010, by District): $12,233

Prev
Next
#44 University Pk Campus School
Worcester, MA
2014 Overall MA Rank: #249
Enrollment (2010–2011): 148
Testing
Proficient or Higher ENGLISH LANGUAGE ARTS (ELA) 2011: 94%
Proficient or Higher MATH 2011: 74%
Proficient or Higher SCIENCE 2011: 62%
Average Total SAT Score: 1384
2014 performance at a glance
Student to Teacher Ratio (2010–2011): 13.3
4-Year Graduation Rates (2010): 100%
Spending per Student (2009–2010, by District): $13,489

Prev
Next
#43 Clinton Senior High
Clinton, MA
2014 Overall MA Rank: #246
Enrollment (2010–2011): 466
Testing
Proficient or Higher ENGLISH LANGUAGE ARTS (ELA) 2011: 95%
Proficient or Higher MATH 2011: 79%
Proficient or Higher SCIENCE 2011: 65%
Average Total SAT Score: 1473
2014 performance at a glance
Student to Teacher Ratio (2010–2011): 13.6
4-Year Graduation Rates (2010): 89.1%
Spending per Student (2009–2010, by District): $11,273

Prev
Next
#42 Oxford High
Oxford, MA
2014 Overall MA Rank: #241
Enrollment (2010–2011): 450
Testing
Proficient or Higher ENGLISH LANGUAGE ARTS (ELA) 2011: 84%
Proficient or Higher MATH 2011: 69%
Proficient or Higher SCIENCE 2011: 67%
Average Total SAT Score: 1504
2014 performance at a glance
Student to Teacher Ratio (2010–2011): 11.5
4-Year Graduation Rates (2010): 80.6%
Spending per Student (2009–2010, by District): $11,955

Prev
Next
#41 Uxbridge High
Uxbridge, MA
2014 Overall MA Rank: #234
Enrollment (2010–2011): 478
Testing
Proficient or Higher ENGLISH LANGUAGE ARTS (ELA) 2011: 87%
Proficient or Higher MATH 2011: 76%
Proficient or Higher SCIENCE 2011: 77%
Average Total SAT Score: 1548
2014 performance at a glance
Student to Teacher Ratio (2010–2011): 15.8
4-Year Graduation Rates (2010): 89.2%
Spending per Student (2009–2010, by District): $12,074

Prev
Next
#40 Northbridge High
Whitinsville, MA
2014 Overall MA Rank: #222
Enrollment (2010–2011): 677
Testing
Proficient or Higher ENGLISH LANGUAGE ARTS (ELA) 2011: 92%
Proficient or Higher MATH 2011: 74%
Proficient or Higher SCIENCE 2011: 75%
Average Total SAT Score: 1525
2014 performance at a glance
Student to Teacher Ratio (2010–2011): 12.6
4-Year Graduation Rates (2010): 84.2%
Spending per Student (2009–2010, by District): $11,129

Prev
Next
#39 Douglas High School
Douglas, MA
2014 Overall MA Rank: #220
Enrollment (2010–2011): 573
Testing
Proficient or Higher ENGLISH LANGUAGE ARTS (ELA) 2011: 93%
Proficient or Higher MATH 2011: 81%
Proficient or Higher SCIENCE 2011: 78%
Average Total SAT Score: 1538
2014 performance at a glance
Student to Teacher Ratio (2010–2011): 13.1
4-Year Graduation Rates (2010): 85.1%
Spending per Student (2009–2010, by District): $10,070

Prev
Next
#38 Shepherd Hill Regional High
Dudley, MA
2014 Overall MA Rank: #219
Enrollment (2010–2011): 1106
Testing
Proficient or Higher ENGLISH LANGUAGE ARTS (ELA) 2011: 93%
Proficient or Higher MATH 2011: 86%
Proficient or Higher SCIENCE 2011: 84%
Average Total SAT Score: 1523
2014 performance at a glance
Student to Teacher Ratio (2010–2011): 15.1
4-Year Graduation Rates (2010): 93.9%
Spending per Student (2009–2010, by District): $10,624

Prev
Next
#37 Milford High
Milford, MA
2014 Overall MA Rank: #216
Enrollment (2010–2011): 1111
Testing
Proficient or Higher ENGLISH LANGUAGE ARTS (ELA) 2011: 92%
Proficient or Higher MATH 2011: 80%
Proficient or Higher SCIENCE 2011: 72%
Average Total SAT Score: 1512
2014 performance at a glance
Student to Teacher Ratio (2010–2011): 13.6
4-Year Graduation Rates (2010): 87.5%
Spending per Student (2009–2010, by District): $12,284

Prev
Next
#36 Abby Kelley Foster Charter
Worcester, MA
2014 Overall MA Rank: #214
Enrollment (2010–2011): 343
Testing
Proficient or Higher ENGLISH LANGUAGE ARTS (ELA) 2011: 100%
Proficient or Higher MATH 2011: 88%
Proficient or Higher SCIENCE 2011: 70%
Average Total SAT Score: 1386
2014 performance at a glance
Student to Teacher Ratio (2010–2011): 12.8
4-Year Graduation Rates (2010): 92%
Spending per Student (2009–2010, by District): $13,489

Prev
Next
#35 Gardner High
Gardner, MA
2014 Overall MA Rank: #201
Enrollment (2010–2011): 563
Testing
Proficient or Higher ENGLISH LANGUAGE ARTS (ELA) 2011: 94%
Proficient or Higher MATH 2011: 80%
Proficient or Higher SCIENCE 2011: 70%
Average Total SAT Score: 1534
2014 performance at a glance
Student to Teacher Ratio (2010–2011): 12.4
4-Year Graduation Rates (2010): 87.4%
Spending per Student (2009–2010, by District): $11,310

Prev
Next
#34 Narragansett Regional High
Baldwinville, MA
2014 Overall MA Rank: #199
Enrollment (2010–2011): 385
Testing
Proficient or Higher ENGLISH LANGUAGE ARTS (ELA) 2011: 97%
Proficient or Higher MATH 2011: 82%
Proficient or Higher SCIENCE 2011: 82%
Average Total SAT Score: 1438
2014 performance at a glance
Student to Teacher Ratio (2010–2011): 11.7
4-Year Graduation Rates (2010): 92.6%
Spending per Student (2009–2010, by District): $11,738

Prev
Next
#33 North Brookfield High
North Brookfield, MA
2014 Overall MA Rank: #198
Enrollment (2010–2011): 223
Testing
Proficient or Higher ENGLISH LANGUAGE ARTS (ELA) 2011: 97%
Proficient or Higher MATH 2011: 77%
Proficient or Higher SCIENCE 2011: 71%
Average Total SAT Score: 1448
2014 performance at a glance
Student to Teacher Ratio (2010–2011): 10.1
4-Year Graduation Rates (2010): 84.6%
Spending per Student (2009–2010, by District): $12,295

Prev
Next
#32 North Central Charter Essential
Fitchburg, MA
2014 Overall MA Rank: #197
Enrollment (2010–2011): 219
Testing
Proficient or Higher ENGLISH LANGUAGE ARTS (ELA) 2011: 95%
Proficient or Higher MATH 2011: 89%
Proficient or Higher SCIENCE 2011: 54%
Average Total SAT Score: 1429
2014 performance at a glance
Student to Teacher Ratio (2010–2011): 9.4
4-Year Graduation Rates (2010): 86.3%
Spending per Student (2009–2010, by District): $12,681

Prev
Next
#31 Montachusett Regional Vocational
Fitchburg, MA
2014 Overall MA Rank: #193
Enrollment (2010–2011): 1433
Testing
Proficient or Higher ENGLISH LANGUAGE ARTS (ELA) 2011: 95%
Proficient or Higher MATH 2011: 80%
Proficient or Higher SCIENCE 2011: 72%
Average Total SAT Score: 1387
2014 performance at a glance
Student to Teacher Ratio (2010–2011): 13.9
4-Year Graduation Rates (2010): 96.6%
Spending per Student (2009–2010, by District): $17,281

Prev
Next
#30 Assabet Valley Vocational High
Marlborough, MA
2014 Overall MA Rank: #183
Enrollment (2010–2011): 1026
Testing
Proficient or Higher ENGLISH LANGUAGE ARTS (ELA) 2011: 93%
Proficient or Higher MATH 2011: 77%
Proficient or Higher SCIENCE 2011: 76%
Average Total SAT Score: 1322
2014 performance at a glance
Student to Teacher Ratio (2010–2011): 10.6
4-Year Graduation Rates (2010): 90.8%
Spending per Student (2009–2010, by District): $17,360

Prev
Next
#29 North Middlesex Regional
Townsend, MA
2014 Overall MA Rank: #182
Enrollment (2010–2011): 956
Testing
Proficient or Higher ENGLISH LANGUAGE ARTS (ELA) 2011: 97%
Proficient or Higher MATH 2011: 87%
Proficient or Higher SCIENCE 2011: 79%
Average Total SAT Score: 1545
2014 performance at a glance
Student to Teacher Ratio (2010–2011): 14.4
4-Year Graduation Rates (2010): 93.7%
Spending per Student (2009–2010, by District): $11,461

Prev
Next
#28 West Boylston Jr Sr High
West Boylston, MA
2014 Overall MA Rank: #178
Enrollment (2010–2011): 278
Testing
Proficient or Higher ENGLISH LANGUAGE ARTS (ELA) 2011: 94%
Proficient or Higher MATH 2011: 83%
Proficient or Higher SCIENCE 2011: 81%
Average Total SAT Score: 1470
2014 performance at a glance
Student to Teacher Ratio (2010–2011): 11.4
4-Year Graduation Rates (2010): 89.1%
Spending per Student (2009–2010, by District): $12,384

Prev
Next
#27 Quaboag Regional High
Warren, MA
2014 Overall MA Rank: #177
Enrollment (2010–2011): 364
Testing
Proficient or Higher ENGLISH LANGUAGE ARTS (ELA) 2011: 92%
Proficient or Higher MATH 2011: 86%
Proficient or Higher SCIENCE 2011: 81%
Average Total SAT Score: 1521
2014 performance at a glance
Student to Teacher Ratio (2010–2011): 11.8
4-Year Graduation Rates (2010): 79.4%
Spending per Student (2009–2010, by District): $12,077

Prev
Next
#26 Southwich-Tolland Regional High
Southwick, MA
2014 Overall MA Rank: #172
Enrollment (2010–2011): 544
Testing
Proficient or Higher ENGLISH LANGUAGE ARTS (ELA) 2011: 94%
Proficient or Higher MATH 2011: 81%
Proficient or Higher SCIENCE 2011: 75%
Average Total SAT Score: 1552
2014 performance at a glance
Student to Teacher Ratio (2010–2011): 12
4-Year Graduation Rates (2010): 88.1%
Spending per Student (2009–2010, by District): $11,547

Prev
Next
#25 Grafton High School
Grafton, MA
2014 Overall MA Rank: #168
Enrollment (2010–2011): 767
Testing
Proficient or Higher ENGLISH LANGUAGE ARTS (ELA) 2011: 93%
Proficient or Higher MATH 2011: 89%
Proficient or Higher SCIENCE 2011: 87%
Average Total SAT Score: 1578
2014 performance at a glance
Student to Teacher Ratio (2010–2011): 13.7
4-Year Graduation Rates (2010): 93.4%
Spending per Student (2009–2010, by District): $10,064

Prev
Next
#24 Sutton High School
Sutton, MA
2014 Overall MA Rank: #164
Enrollment (2010–2011): 418
Testing
Proficient or Higher ENGLISH LANGUAGE ARTS (ELA) 2011: 94%
Proficient or Higher MATH 2011: 91%
Proficient or Higher SCIENCE 2011: 75%
Average Total SAT Score: 1596
2014 performance at a glance
Student to Teacher Ratio (2010–2011): 14.6
4-Year Graduation Rates (2010): 94.1%
Spending per Student (2009–2010, by District): $11,329

Prev
Next
#23 Marlborough High
Marlborough, MA
2014 Overall MA Rank: #162
Enrollment (2010–2011): 1075
Testing
Proficient or Higher ENGLISH LANGUAGE ARTS (ELA) 2011: 89%
Proficient or Higher MATH 2011: 79%
Proficient or Higher SCIENCE 2011: 67%
Average Total SAT Score: 1515
2014 performance at a glance
Student to Teacher Ratio (2010–2011): 10.7
4-Year Graduation Rates (2010): 84.1%
Spending per Student (2009–2010, by District): $14,198

Prev
Next
#22 Hopedale Jr. Sr. High
Hopedale, MA
2014 Overall MA Rank: #161
Enrollment (2010–2011): 344
Testing
Proficient or Higher ENGLISH LANGUAGE ARTS (ELA) 2011: 100%
Proficient or Higher MATH 2011: 94%
Proficient or Higher SCIENCE 2011: 84%
Average Total SAT Score: 1519
2014 performance at a glance
Student to Teacher Ratio (2010–2011): 13.4
4-Year Graduation Rates (2010): 96.6%
Spending per Student (2009–2010, by District): $10,448

Prev
Next
#21 Bay Path Regional Vocation Technical
Charlton, MA
2014 Overall MA Rank: #156
Enrollment (2010–2011): 1104
Testing
Proficient or Higher ENGLISH LANGUAGE ARTS (ELA) 2011: 93%
Proficient or Higher MATH 2011: 82%
Proficient or Higher SCIENCE 2011: 75%
Average Total SAT Score: 1346
2014 performance at a glance
Student to Teacher Ratio (2010–2011): 9.9
4-Year Graduation Rates (2010): 90.5%
Spending per Student (2009–2010, by District): $16,966

Prev
Next
#20 Hudson High
Hudson, MA
2014 Overall MA Rank: #154
Enrollment (2010–2011): 1113
Testing
Proficient or Higher ENGLISH LANGUAGE ARTS (ELA) 2011: 98%
Proficient or Higher MATH 2011: 91%
Proficient or Higher SCIENCE 2011: 73%
Average Total SAT Score: 1475
2014 performance at a glance
Student to Teacher Ratio (2010–2011): 12
4-Year Graduation Rates (2010): 90.2%
Spending per Student (2009–2010, by District): $13,294

Prev
Next
#19 Wachusset Regional High
Holden, MA
2014 Overall MA Rank: #152
Enrollment (2010–2011): 2095
Testing
Proficient or Higher ENGLISH LANGUAGE ARTS (ELA) 2011: 96%
Proficient or Higher MATH 2011: 91%
Proficient or Higher SCIENCE 2011: 83%
Average Total SAT Score: 1617
2014 performance at a glance
Student to Teacher Ratio (2010–2011): 15.1
4-Year Graduation Rates (2010): 93%
Spending per Student (2009–2010, by District): $10,817

Prev
Next
#18 Millbury Junior/Senior High
Millbury, MA
2014 Overall MA Rank: #150
Enrollment (2010–2011): 713
Testing
Proficient or Higher ENGLISH LANGUAGE ARTS (ELA) 2011: 95%
Proficient or Higher MATH 2011: 80%
Proficient or Higher SCIENCE 2011: 68%
Average Total SAT Score: 1517
2014 performance at a glance
Student to Teacher Ratio (2010–2011): 11.2
4-Year Graduation Rates (2010): 89.7%
Spending per Student (2009–2010, by District): $13,444

Prev
Next
#17 Oakmont Regional High School
Ashburnham, MA
2014 Overall MA Rank: #148
Enrollment (2010–2011): 689
Testing
Proficient or Higher ENGLISH LANGUAGE ARTS (ELA) 2011: 99%
Proficient or Higher MATH 2011: 89%
Proficient or Higher SCIENCE 2011: 86%
Average Total SAT Score: 1567
2014 performance at a glance
Student to Teacher Ratio (2010–2011): 15.3
4-Year Graduation Rates (2010): 95.1%
Spending per Student (2009–2010, by District): $12,027

Prev
Next
#16 Ayer Shirley Regional High School
Ayer, MA
2014 Overall MA Rank: #146
Enrollment (2010–2011): 325
Testing
Proficient or Higher ENGLISH LANGUAGE ARTS (ELA) 2011: 95%
Proficient or Higher MATH 2011: 88%
Proficient or Higher SCIENCE 2011: 85%
Average Total SAT Score: 1447
2014 performance at a glance
Student to Teacher Ratio (2010–2011): 10.3
4-Year Graduation Rates (2010): 83.8%
Spending per Student (2009–2010, by District): $13,040

Prev
Next
#15 Auburn Senior High
Auburn, MA
2014 Overall MA Rank: #144
Enrollment (2010–2011): 689
Testing
Proficient or Higher ENGLISH LANGUAGE ARTS (ELA) 2011: 95%
Proficient or Higher MATH 2011: 89%
Proficient or Higher SCIENCE 2011: 84%
Average Total SAT Score: 1489
2014 performance at a glance
Student to Teacher Ratio (2010–2011): 11.8
4-Year Graduation Rates (2010): 94.7%
Spending per Student (2009–2010, by District): $12,211

Prev
Next
#14 Nipmuc Regional High
Upton, MA
2014 Overall MA Rank: #134
Enrollment (2010–2011): 667
Testing
Proficient or Higher ENGLISH LANGUAGE ARTS (ELA) 2011: 95%
Proficient or Higher MATH 2011: 94%
Proficient or Higher SCIENCE 2011: 90%
Average Total SAT Score: 1557
2014 performance at a glance
Student to Teacher Ratio (2010–2011): 13.8
4-Year Graduation Rates (2010): 96.8%
Spending per Student (2009–2010, by District): $11,242

Prev
Next
#13 Shrewsbury Sr. High
Shrewsbury, MA
2014 Overall MA Rank: #117
Enrollment (2010–2011): 1647
Testing
Proficient or Higher ENGLISH LANGUAGE ARTS (ELA) 2011: 98%
Proficient or Higher MATH 2011: 94%
Proficient or Higher SCIENCE 2011: 90%
Average Total SAT Score: 1677
2014 performance at a glance
Student to Teacher Ratio (2010–2011): 16.9
4-Year Graduation Rates (2010): 94.7%
Spending per Student (2009–2010, by District): $11,318

Prev
Next
#12 Lunenburg High
Lunenburg, MA
2014 Overall MA Rank: #104
Enrollment (2010–2011): 577
Testing
Proficient or Higher ENGLISH LANGUAGE ARTS (ELA) 2011: 97%
Proficient or Higher MATH 2011: 96%
Proficient or Higher SCIENCE 2011: 97%
Average Total SAT Score: 1546
2014 performance at a glance
Student to Teacher Ratio (2010–2011): 13
4-Year Graduation Rates (2010): 96.8%
Spending per Student (2009–2010, by District): $11,448

Prev
Next
#11 Blackstone Valley Reg. Vocational
Upton, MA
2014 Overall MA Rank: #85
Enrollment (2010–2011): 1164
Testing
Proficient or Higher ENGLISH LANGUAGE ARTS (ELA) 2011: 99%
Proficient or Higher MATH 2011: 95%
Proficient or Higher SCIENCE 2011: 91%
Average Total SAT Score: 1434
2014 performance at a glance
Student to Teacher Ratio (2010–2011): 13.2
4-Year Graduation Rates (2010): 97.8%
Spending per Student (2009–2010, by District): $17,131

Prev
Next
#10 Tahanto Regional High
Boylston), MA
2014 Overall MA Rank: #80
Enrollment (2010–2011): 282
Testing
Proficient or Higher ENGLISH LANGUAGE ARTS (ELA) 2011: 95%
Proficient or Higher MATH 2011: 89%
Proficient or Higher SCIENCE 2011: 94%
Average Total SAT Score: 1613
2014 performance at a glance
Student to Teacher Ratio (2010–2011): 12.7
4-Year Graduation Rates (2010): 86.9%
Spending per Student (2009–2010, by District): $13,409

Prev
Next
#9 Nashoba Regional
Bolton, MA
2014 Overall MA Rank: #76
Enrollment (2010–2011): 1033
Testing
Proficient or Higher ENGLISH LANGUAGE ARTS (ELA) 2011: 95%
Proficient or Higher MATH 2011: 92%
Proficient or Higher SCIENCE 2011: 87%
Average Total SAT Score: 1680
2014 performance at a glance
Student to Teacher Ratio (2010–2011): 14.6
4-Year Graduation Rates (2010): 95.1%
Spending per Student (2009–2010, by District): $12,686
Prev
Next
#8 Leominster High School & Ctr for Tech
Leominster, MA
2014 Overall MA Rank: #64
Enrollment (2010–2011): 34
Testing
Proficient or Higher ENGLISH LANGUAGE ARTS (ELA) 2011: 85%
Proficient or Higher MATH 2011: 82%
Proficient or Higher SCIENCE 2011: 75%
Average Total SAT Score: 1416
2014 performance at a glance
Student to Teacher Ratio (2010–2011):
4-Year Graduation Rates (2010): 92.6%
Spending per Student (2009–2010, by District): $12,233
Prev
Next
#7 Tantasqua Regional Sr. High
Fiskdale, MA
2014 Overall MA Rank: #63
Enrollment (2010–2011): 756
Testing
Proficient or Higher ENGLISH LANGUAGE ARTS (ELA) 2011: 97%
Proficient or Higher MATH 2011: 86%
Proficient or Higher SCIENCE 2011: 75%
Average Total SAT Score: 1607
2014 performance at a glance
Student to Teacher Ratio (2010–2011): 9.7
4-Year Graduation Rates (2010): 94.9%
Spending per Student (2009–2010, by District): $12,985

Prev
Next
#6 Groton Dunstable Regional
Groton, MA
2014 Overall MA Rank: #62
Enrollment (2010–2011): 870
Testing
Proficient or Higher ENGLISH LANGUAGE ARTS (ELA) 2011: 99%
Proficient or Higher MATH 2011: 98%
Proficient or Higher SCIENCE 2011: 95%
Average Total SAT Score: 1664
2014 performance at a glance
Student to Teacher Ratio (2010–2011): 14.6
4-Year Graduation Rates (2010): 97%
Spending per Student (2009–2010, by District): $12,261

Prev
Next
#5 Hopkinton High
Hopkinton, MA
2014 Overall MA Rank: #53
Enrollment (2010–2011): 1150
Testing
Proficient or Higher ENGLISH LANGUAGE ARTS (ELA) 2011: 98%
Proficient or Higher MATH 2011: 95%
Proficient or Higher SCIENCE 2011: 93%
Average Total SAT Score: 1688
2014 performance at a glance
Student to Teacher Ratio (2010–2011): 14.5
4-Year Graduation Rates (2010): 99.2%
Spending per Student (2009–2010, by District): $12,472

Prev
Next
#4 Algonquin Regional High
Northborough, MA
2014 Overall MA Rank: #33
Enrollment (2010–2011): 1471
Testing
Proficient or Higher ENGLISH LANGUAGE ARTS (ELA) 2011: 99%
Proficient or Higher MATH 2011: 95%
Proficient or Higher SCIENCE 2011: 96%
Average Total SAT Score: 1715
2014 performance at a glance
Student to Teacher Ratio (2010–2011): 14.3
4-Year Graduation Rates (2010): 97.5%
Spending per Student (2009–2010, by District): $13,900
Prev
Next
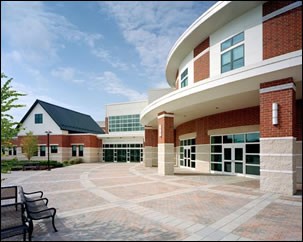
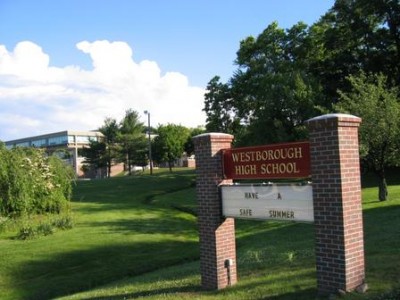
#3 Westborough High
Westborough, MA
2014 Overall MA Rank: #26
Enrollment (2010–2011): 1053
Testing
Proficient or Higher ENGLISH LANGUAGE ARTS (ELA) 2011: 97%
Proficient or Higher MATH 2011: 93%
Proficient or Higher SCIENCE 2011: 95%
Average Total SAT Score: 1716
2014 performance at a glance
Student to Teacher Ratio (2010–2011): 12.6
4-Year Graduation Rates (2010): 96.6%
Spending per Student (2009–2010, by District): $14,545
Prev
Next
#2 Bromfield
Harvard, MA
2014 Overall MA Rank: #13
Enrollment (2010–2011): 709
Testing
Proficient or Higher ENGLISH LANGUAGE ARTS (ELA) 2011: 100%
Proficient or Higher MATH 2011: 97%
Proficient or Higher SCIENCE 2011: 97%
Average Total SAT Score: 1824
2014 performance at a glance
Student to Teacher Ratio (2010–2011): 13.8
4-Year Graduation Rates (2010): 98.3%
Spending per Student (2009–2010, by District): $13,984

Prev
Next
#1 Advanced Math and Science Academy
Marlborough, MA
2014 Overall MA Rank: #6
Enrollment (2010–2011): 567
Testing
Proficient or Higher ENGLISH LANGUAGE ARTS (ELA) 2011: 100%
Proficient or Higher MATH 2011: 100%
Proficient or Higher SCIENCE 2011: 98%
Average Total SAT Score: 1825
2014 performance at a glance
Student to Teacher Ratio (2010–2011): 11.5
4-Year Graduation Rates (2010): 98.6%
Spending per Student (2009–2010, by District): $14,198
Related Articles
Enjoy this post? Share it with others.
Email to a friend
Permalink


 Delivered Free Every
Follow us on Pinterest Google + Facebook Twitter See It Read It