John Monfredo: This School Year Let’s Stop Chronic Absenteeism From Occurring…


 Email to a friend
Permalink
Email to a friend
Permalink
Saturday, August 23, 2014
John Monfredo, GoLocalWorcester MINDSETTER
School is right around the corner and school districts need to consider launching a drive for September for “Attendance Awareness Month.” It’s an issue that is a major problem within school districts and we need to address this problem with vigor. Statistics show that students with more than 20 absences per year have less than a 1-in-5 chance of graduating. By ninth grade, school attendance is a better predictor of graduation than eighth-grade test scores, according to a study by the University of Chicago.
Research continues to show that attendance at all ages is exceedingly important and as mentioned is correlated to student success and graduation rates. Many times parents think my child is only in the kindergarten so if they miss school for a week what’s all fuss about? Well, researcher Hedy Chang found that when students are chronically absent (Absent 10% of the school year or over 18 times during the year) during the kindergarten years that the students perform lower academically in first grade. This is true “regardless of gender, ethnicity or socioeconomic status.”
According to the report it is especially strong for Latino children who had a much lower first grade reading scores if they were chronically absent in the kindergarten. The report also showed that children living in poverty suffer more academically when they miss school during the early years. Among poor children, chronic absence in the early grades predicts the lowest levels of achievement at the end of fifth grade. In addition, these same children have trouble mastering reading and math by the end of the third grade. A common sense approach suggests that attending school regularly helps develop a strong foundation for learning and during the elementary years, children are gaining basic social and academic skills critical for further learning.
All students, but especially students in poverty, benefit from being in school. Thus one of the most effective strategies for providing pathways out of poverty is to do all that it takes to get these students in school every day. This alone, even without improvements in the American education system will drive up achievement, high school graduation, and college attainment rates.
"You want to improve test scores? Get your kids to show up," said Hedy Chang, director of Attendance Works, a policy group focused on chronic absence and a strong advocate on this issue. She went on to say, "You can innovate all you want, but if the kid’s not there, the benefit from the innovation is going to have limited impact."
Despite awareness campaign on absenteeism last year the Worcester Public Schools, like all urban centers, still has a chronic absenteeism problem. What has to be done is to review last year’s strategies and make modifications. The data for last year shows that 12.2% of the student body had a chronic absentee problem. It was about the same in the previous year. Thirteen of our elementary schools out of 33 have percentages close to 12% or more. Schools with the lowest chronic absentee rates were our level one schools. What does that tell you? On the secondary level all but three schools out of twelve had a high level of chronic absenteeism with several of our high schools over 25% or one-fourth of their student body having a problem with attendance.
Everyone needs to take the issue of attendance improvement as a priority for the schools need to create a climate of change including a plan, responsibilities, timeline and resources. As a school system we need to renew our efforts to improve attendance and continue with our public media campaign about the importance of attending school. Let’s continue to reach out to the community for assistance. With limited resources there is no way the school district can do this by themselves for partnerships with the community are needed. Here are some suggestions:
Let’s set up bench marks to reduce those numbers for this year. Could we reduce the number by three percent? An effort needs to be made to have a close, often weekly, measurement of tracking absenteeism.
At the start of the new school year flag students who were chronically absent and start individual education plans for those students at risk. (As we do for Special Education Students). Data analysis is the key to figuring out which schools need the most help.
Start communicating with parents in the early grades about the importance of attendance and let them understand the importance of attendance in their home language and in culturally appropriate ways.
Monitor attendance, as mentioned, weekly and follow-up with those students who are a risk. Have those students assigned a buddy… it could be an older student, staff member or a community volunteer.
Look for health support for students inside and outside of the school.
Make every school a place where students feel safe and respected and make relationships between students and the schools more personal. Be sure adults (secretaries, aides, etc.) make individual contact with high risk students on a daily basis and give appropriate training to those staff members.
Make home visits a priority and consider a flexible schedule for counselors so that they can visit families over the weekends.
Hold educational meetings for parents whose students are chronically absent and make resources available at the meeting for them. The meeting should be educational but not punitive. Include in the workshop tips for parents on homework, organizational skills at home and information about absenteeism.
Schools need to reward and recognize individuals and classes for improved attendance and not just perfect attendance. Have a monthly assembly and pass out certificates and other prizes for attendance improvement. Put the names of those students in your monthly newsletter that goes home.
Although families, especially those with limited resources, face significant challenges in getting their children to school, attending school must be a priority for the community. As mentioned, there should be a partnership within the community with everyone working on addressing the assortment of barriers that many children face such as a lack of transportation to access health care opportunities. Making positive changes with attendance will lead to better parent engagement in other aspects of a child’s education.
This issue will not go away by itself and will need a community effort to resolve it. Let’s get the ball rolling now and start planning now for the new school year. Look for more information on this issue in future columns for all of us must be vigilant in making a difference for our children in this community.
Related Slideshow: MA’s Top 100 High Schools 2014
Prev
Next
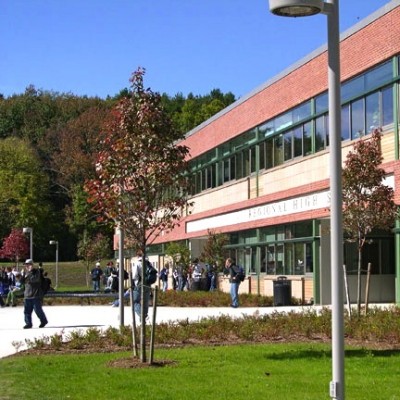
#100 Pentucket Regional Sr High
Pentucket Regional Sr High
West Newbury, MA
2013 Rank: 61
Enrollment (2010–2011): 785
Testing
Proficient or Higher ENGLISH LANGUAGE ARTS (ELA) 2011: 97%
Proficient or Higher MATH 2011: 88%
Proficient or Higher SCIENCE 2011: 83%
Average Total SAT Score: 1638
2014 performance at a glance
Student to Teacher Ratio (2010–2011): 13.5
4-Year Graduation Rates (2010): 92.7%
Spending per Student (2009–2010, by District): $11,821
Prev
Next
#99 Scituate High School
Scituate High School
Scituate, MA
2013 Rank: 110
Enrollment (2010–2011): 947
Testing
Proficient or Higher ENGLISH LANGUAGE ARTS (ELA) 2011: 99%
Proficient or Higher MATH 2011: 96%
Proficient or Higher SCIENCE 2011: 86%
Average Total SAT Score: 1625
2014 performance at a glance
Student to Teacher Ratio (2010–2011): 15.1
4-Year Graduation Rates (2010): 93.4%
Spending per Student (2009–2010, by District): $12,311
Prev
Next
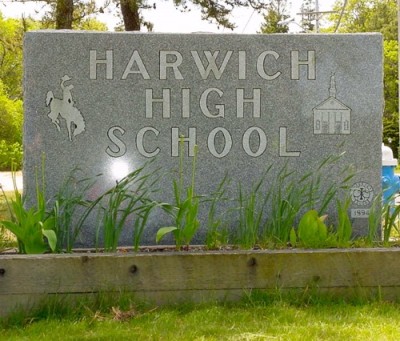
#98 Harwich High
Harwich High
Harwich, MA
2013 Rank: 47
Enrollment (2010–2011): 313
Testing
Proficient or Higher ENGLISH LANGUAGE ARTS (ELA) 2011: 100%
Proficient or Higher MATH 2011: 93%
Proficient or Higher SCIENCE 2011: %
Average Total SAT Score: 1609
2014 performance at a glance
Student to Teacher Ratio (2010–2011): 8.5
4-Year Graduation Rates (2010): 93.3%
Spending per Student (2009–2010, by District): $14,511

Prev
Next
#97 Boston Preparatory Charter Public Sc
Boston Preparatory Charter Public School (Charter)
Hyde Park, MA
2013 Rank: 138
Enrollment (2010–2011): 371
Testing
Proficient or Higher ENGLISH LANGUAGE ARTS (ELA) 2011: 98%
Proficient or Higher MATH 2011: 98%
Proficient or Higher SCIENCE 2011: 88%
Average Total SAT Score: 1343
2014 performance at a glance
Student to Teacher Ratio (2010–2011): 10.8
4-Year Graduation Rates (2010): 92.3%
Spending per Student (2009–2010, by District): $17,283
Prev
Next
#96 Blue Hills Regional Vocational Techn
Blue Hills Regional Vocational Technical
Canton, MA
2013 Rank: 208
Enrollment (2010–2011): 842
Testing
Proficient or Higher ENGLISH LANGUAGE ARTS (ELA) 2011: 96%
Proficient or Higher MATH 2011: 81%
Proficient or Higher SCIENCE 2011: 78%
Average Total SAT Score: 1324
2014 performance at a glance
Student to Teacher Ratio (2010–2011): 11.4
4-Year Graduation Rates (2010): 97.3%
Spending per Student (2009–2010, by District): $21,209
Prev
Next
#95 Old Colony Regional Vocational Techn
Old Colony Regional Vocational Technical
Rochester, MA
2013 Rank: 81
Enrollment (2010–2011): 579
Testing
Proficient or Higher ENGLISH LANGUAGE ARTS (ELA) 2011: 99%
Proficient or Higher MATH 2011: 88%
Proficient or Higher SCIENCE 2011: 73%
Average Total SAT Score: 1372
2014 performance at a glance
Student to Teacher Ratio (2010–2011): 10.5
4-Year Graduation Rates (2010): 99.2%
Spending per Student (2009–2010, by District): $17,935
Prev
Next
#94 Maynard High
Maynard High
Maynard, MA
2013 Rank: 87
Enrollment (2010–2011): 430
Testing
Proficient or Higher ENGLISH LANGUAGE ARTS (ELA) 2011: 94%
Proficient or Higher MATH 2011: 87%
Proficient or Higher SCIENCE 2011: 78%
Average Total SAT Score: 1605
2014 performance at a glance
Student to Teacher Ratio (2010–2011): 12.7
4-Year Graduation Rates (2010): 90.8%
Spending per Student (2009–2010, by District): $13,822

Prev
Next
#93 Salem Academy Charter School
Salem Academy Charter School (Charter)
Shetland Park, MA
2013 Rank: 233
Enrollment (2010–2011): 180
Testing
Proficient or Higher ENGLISH LANGUAGE ARTS (ELA) 2011: 100%
Proficient or Higher MATH 2011: 95%
Proficient or Higher SCIENCE 2011: 84%
Average Total SAT Score: 1420
2014 performance at a glance
Student to Teacher Ratio (2010–2011): 9.5
4-Year Graduation Rates (2010): 87.5%
Spending per Student (2009–2010, by District): $14,706
Prev
Next
#92 Wahconah Regional High
Wahconah Regional High
Dalton, MA
2013 Rank: 96
Enrollment (2010–2011): 563
Testing
Proficient or Higher ENGLISH LANGUAGE ARTS (ELA) 2011: 97%
Proficient or Higher MATH 2011: 87%
Proficient or Higher SCIENCE 2011: 92%
Average Total SAT Score: 1565
2014 performance at a glance
Student to Teacher Ratio (2010–2011): 12.3
4-Year Graduation Rates (2010): 89.1%
Spending per Student (2009–2010, by District): $13,282
Prev
Next
#91 Academy of the Pacific Rim Charter P
Academy of the Pacific Rim Charter Public School (Charter)
Hyde Park, MA
2013 Rank: 157
Enrollment (2010–2011): 209
Testing
Proficient or Higher ENGLISH LANGUAGE ARTS (ELA) 2011: 100%
Proficient or Higher MATH 2011: 92%
Proficient or Higher SCIENCE 2011: 76%
Average Total SAT Score: 1465
2014 performance at a glance
Student to Teacher Ratio (2010–2011): 12.9
4-Year Graduation Rates (2010): 92.6%
Spending per Student (2009–2010, by District): $17,283
Prev
Next
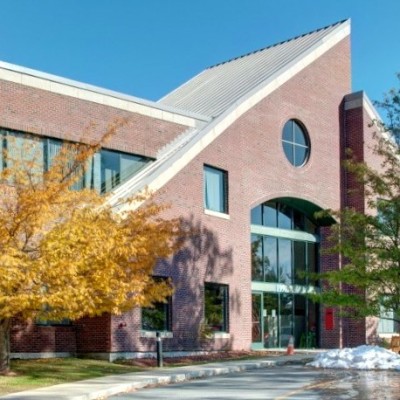
#90 Reading Memorial High
Reading Memorial High
Reading, MA
2013 Rank: 84
Enrollment (2010–2011): 1307
Testing
Proficient or Higher ENGLISH LANGUAGE ARTS (ELA) 2011: 98%
Proficient or Higher MATH 2011: 94%
Proficient or Higher SCIENCE 2011: 90%
Average Total SAT Score: 1653
2014 performance at a glance
Student to Teacher Ratio (2010–2011): 14.3
4-Year Graduation Rates (2010): 96.6%
Spending per Student (2009–2010, by District): $11,051
Prev
Next
#89 Falmouth High
Falmouth High
Falmouth, MA
2013 Rank: 93
Enrollment (2010–2011): 857
Testing
Proficient or Higher ENGLISH LANGUAGE ARTS (ELA) 2011: 95%
Proficient or Higher MATH 2011: 86%
Proficient or Higher SCIENCE 2011: 79%
Average Total SAT Score: 1596
2014 performance at a glance
Student to Teacher Ratio (2010–2011): 13.1
4-Year Graduation Rates (2010): 89.1%
Spending per Student (2009–2010, by District): $14,939
Prev
Next
#88 Somerset Berkley Regional High Schoo
Somerset Berkley Regional High School
Somerset, MA
2013 Rank: 154
Enrollment (2010–2011): 953
Testing
Proficient or Higher ENGLISH LANGUAGE ARTS (ELA) 2011: 98%
Proficient or Higher MATH 2011: 92%
Proficient or Higher SCIENCE 2011: 85%
Average Total SAT Score: 1527
2014 performance at a glance
Student to Teacher Ratio (2010–2011): 11.4
4-Year Graduation Rates (2010): 97.1%
Spending per Student (2009–2010, by District): $13,119
Prev
Next
#87 Cape Cod Regional Vocational Technic
Cape Cod Regional Vocational Technical
Harwich, MA
2013 Rank: 203
Enrollment (2010–2011): 654
Testing
Proficient or Higher ENGLISH LANGUAGE ARTS (ELA) 2011: 93%
Proficient or Higher MATH 2011: 77%
Proficient or Higher SCIENCE 2011: 69%
Average Total SAT Score: 1340
2014 performance at a glance
Student to Teacher Ratio (2010–2011): 9.3
4-Year Graduation Rates (2010): 95.6%
Spending per Student (2009–2010, by District): $21,410

Prev
Next
#86 Canton High
Canton High
Canton, MA
2013 Rank: 77
Enrollment (2010–2011): 853
Testing
Proficient or Higher ENGLISH LANGUAGE ARTS (ELA) 2011: 98%
Proficient or Higher MATH 2011: 88%
Proficient or Higher SCIENCE 2011: 88%
Average Total SAT Score: 1564
2014 performance at a glance
Student to Teacher Ratio (2010–2011): 12
4-Year Graduation Rates (2010): 93.7%
Spending per Student (2009–2010, by District): $13,153
Prev
Next
#85 Blackstone Valley Regional VocTech
Blackstone Valley Regional Vocational Technical
Upton, MA
2013 Rank: 86
Enrollment (2010–2011): 1164
Testing
Proficient or Higher ENGLISH LANGUAGE ARTS (ELA) 2011: 99%
Proficient or Higher MATH 2011: 95%
Proficient or Higher SCIENCE 2011: 91%
Average Total SAT Score: 1434
2014 performance at a glance
Student to Teacher Ratio (2010–2011): 13.2
4-Year Graduation Rates (2010): 97.8%
Spending per Student (2009–2010, by District): $17,131
>
Proficient or Higher ENGLISH LANGUAGE ARTS (ELA) 2011: 99%
Proficient or Higher MATH 2011: 97%
Proficient or Higher SCIENCE 2011: 83%
Average Total SAT Score: 1835
2014 performance at a glance
Student to Teacher Ratio (2010–2011): 10.4
4-Year Graduation Rates (2010): 96.6%
Spending per Student (2009–2010, by District): $19,915
Prev
Next
#84 Arlington High
Arlington High
Arlington, MA
2013 Rank: 71
Enrollment (2010–2011): 1185
Testing
Proficient or Higher ENGLISH LANGUAGE ARTS (ELA) 2011: 98%
Proficient or Higher MATH 2011: 92%
Proficient or Higher SCIENCE 2011: 89%
Average Total SAT Score: 1726
2014 performance at a glance
Student to Teacher Ratio (2010–2011): 17.1
4-Year Graduation Rates (2010): 92.9%
Spending per Student (2009–2010, by District): $12,603

Prev
Next
#83 Shawsheen Valley Vocational Technica
Shawsheen Valley Vocational Technical School
Billerica, MA
2013 Rank: 75
Enrollment (2010–2011): 1372
Testing
Proficient or Higher ENGLISH LANGUAGE ARTS (ELA) 2011: 99%
Proficient or Higher MATH 2011: 86%
Proficient or Higher SCIENCE 2011: 89%
Average Total SAT Score: 1386
2014 performance at a glance
Student to Teacher Ratio (2010–2011): 10.7
4-Year Graduation Rates (2010): 98.2%
Spending per Student (2009–2010, by District): $17,471
Prev
Next
#82 Swampscott High
Swampscott High
Swampscott, MA
2013 Rank: 79
Enrollment (2010–2011): 722
Testing
Proficient or Higher ENGLISH LANGUAGE ARTS (ELA) 2011: 97%
Proficient or Higher MATH 2011: 86%
Proficient or Higher SCIENCE 2011: 87%
Average Total SAT Score: 1582
2014 performance at a glance
Student to Teacher Ratio (2010–2011): 12.4
4-Year Graduation Rates (2010): 94.3%
Spending per Student (2009–2010, by District): $13,746
Prev
Next
#81 Gateway Regional High
Gateway Regional High
Huntington, MA
2013 Rank: 131
Enrollment (2010–2011): 282
Testing
Proficient or Higher ENGLISH LANGUAGE ARTS (ELA) 2011: 99%
Proficient or Higher MATH 2011: 88%
Proficient or Higher SCIENCE 2011: 86%
Average Total SAT Score: 1569
2014 performance at a glance
Student to Teacher Ratio (2010–2011): 10.9
4-Year Graduation Rates (2010): 79.6%
Spending per Student (2009–2010, by District): $13,967

Prev
Next
#80 Tahanto Regional High
Tahanto Regional High
Boylston, MA
2013 Rank: 50
Enrollment (2010–2011): 282
Testing
Proficient or Higher ENGLISH LANGUAGE ARTS (ELA) 2011: 95%
Proficient or Higher MATH 2011: 89%
Proficient or Higher SCIENCE 2011: 94%
Average Total SAT Score: 1613
2014 performance at a glance
Student to Teacher Ratio (2010–2011): 12.7
4-Year Graduation Rates (2010): 86.9%
Spending per Student (2009–2010, by District): $13,409

Prev
Next
#79 Masconomet Regional High School
Masconomet Regional High School
Topsfield, MA
2013 Rank: 67
Enrollment (2010–2011): 1382
Testing
Proficient or Higher ENGLISH LANGUAGE ARTS (ELA) 2011: 98%
Proficient or Higher MATH 2011: 98%
Proficient or Higher SCIENCE 2011: 95%
Average Total SAT Score: 1673
2014 performance at a glance
Student to Teacher Ratio (2010–2011): 17.2
4-Year Graduation Rates (2010): 98.7%
Spending per Student (2009–2010, by District): $13,094

Prev
Next
#78 Georgetown Middle/High
Georgetown Middle/High
Georgetown, MA
2013 Rank: 99
Enrollment (2010–2011): 407
Testing
Proficient or Higher ENGLISH LANGUAGE ARTS (ELA) 2011: 99%
Proficient or Higher MATH 2011: 91%
Proficient or Higher SCIENCE 2011: 93%
Average Total SAT Score: 1624
2014 performance at a glance
Student to Teacher Ratio (2010–2011): 11.9
4-Year Graduation Rates (2010): 96.9%
Spending per Student (2009–2010, by District): $10,511

Prev
Next
#77 Hopkins Academy
Hopkins Academy
Hadley, MA
2013 Rank: 114
Enrollment (2010–2011): 277
Testing
Proficient or Higher ENGLISH LANGUAGE ARTS (ELA) 2011: 100%
Proficient or Higher MATH 2011: 95%
Proficient or Higher SCIENCE 2011: 81%
Average Total SAT Score: 1580
2014 performance at a glance
Student to Teacher Ratio (2010–2011): 10.7
4-Year Graduation Rates (2010): 97.6%
Spending per Student (2009–2010, by District): $11,268
Prev
Next
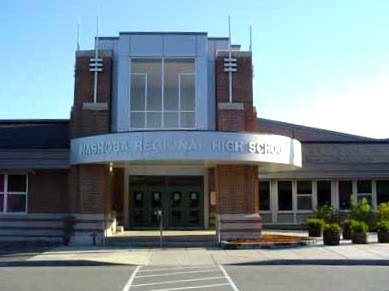
#76 Nashoba Regional
Nashoba Regional
Bolton, MA
2013 Rank: 60
Enrollment (2010–2011): 1033
Testing
Proficient or Higher ENGLISH LANGUAGE ARTS (ELA) 2011: 95%
Proficient or Higher MATH 2011: 92%
Proficient or Higher SCIENCE 2011: 87%
Average Total SAT Score: 1680
2014 performance at a glance
Student to Teacher Ratio (2010–2011): 14.6
4-Year Graduation Rates (2010): 95.1%
Spending per Student (2009–2010, by District): $12,686
Prev
Next
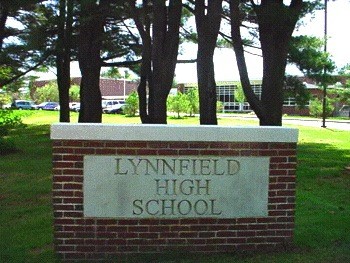
#75 Lynnfield High
Lynnfield High
Lynnfield, MA
2013 Rank: 57
Enrollment (2010–2011): 623
Testing
Proficient or Higher ENGLISH LANGUAGE ARTS (ELA) 2011: 99%
Proficient or Higher MATH 2011: 92%
Proficient or Higher SCIENCE 2011: 93%
Average Total SAT Score: 1582
2014 performance at a glance
Student to Teacher Ratio (2010–2011): 12.5
4-Year Graduation Rates (2010): 99.4%
Spending per Student (2009–2010, by District): $12,215
Prev
Next
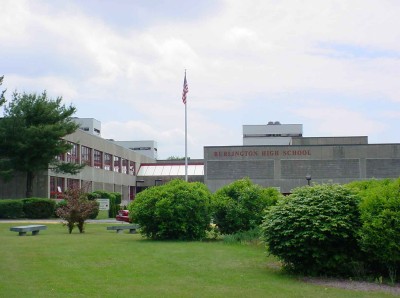
#74 Burlington High
Burlington High
Burlington, MA
2013 Rank: 64
Enrollment (2010–2011): 1135
Testing
Proficient or Higher ENGLISH LANGUAGE ARTS (ELA) 2011: 89%
Proficient or Higher MATH 2011: 92%
Proficient or Higher SCIENCE 2011: 80%
Average Total SAT Score: 1574
2014 performance at a glance
Student to Teacher Ratio (2010–2011): 12.6
4-Year Graduation Rates (2010): 95.5%
Spending per Student (2009–2010, by District): $15,893
Prev
Next
#73 Franklin County Technical
Franklin County Technical
Turners Falls, MA
2013 Rank: 97
Enrollment (2010–2011): 523
Testing
Proficient or Higher ENGLISH LANGUAGE ARTS (ELA) 2011: 88%
Proficient or Higher MATH 2011: 70%
Proficient or Higher SCIENCE 2011: 67%
Average Total SAT Score: 1442
2014 performance at a glance
Student to Teacher Ratio (2010–2011): 9.6
4-Year Graduation Rates (2010): 94.7%
Spending per Student (2009–2010, by District): $21,179

Prev
Next
#72 Natick High
Natick High
Natick, MA
2013 Rank: 67
Enrollment (2010–2011): 1543
Testing
Proficient or Higher ENGLISH LANGUAGE ARTS (ELA) 2011: 98%
Proficient or Higher MATH 2011: 93%
Proficient or Higher SCIENCE 2011: 91%
Average Total SAT Score: 1644
2014 performance at a glance
Student to Teacher Ratio (2010–2011): 14.7
4-Year Graduation Rates (2010): 95.3%
Spending per Student (2009–2010, by District): $13,146
Prev
Next
#71 Mt Everett Regional
Mt Everett Regional
Sheffield, MA
2013 Rank: 112
Enrollment (2010–2011): 227
Testing
Proficient or Higher ENGLISH LANGUAGE ARTS (ELA) 2011: 100%
Proficient or Higher MATH 2011: 87%
Proficient or Higher SCIENCE 2011: 74%
Average Total SAT Score: 1503
2014 performance at a glance
Student to Teacher Ratio (2010–2011): 10.2
4-Year Graduation Rates (2010): 87.8%
Spending per Student (2009–2010, by District): $16,100
Prev
Next
#70 Holliston High
Holliston High
Holliston, MA
2013 Rank: 41
Enrollment (2010–2011): 819
Testing
Proficient or Higher ENGLISH LANGUAGE ARTS (ELA) 2011: 97%
Proficient or Higher MATH 2011: 91%
Proficient or Higher SCIENCE 2011: 90%
Average Total SAT Score: 1625
2014 performance at a glance
Student to Teacher Ratio (2010–2011): 12.3
4-Year Graduation Rates (2010): 96.2%
Spending per Student (2009–2010, by District): $12,198
Prev
Next
#69 Hampshire Regional High
Hampshire Regional High
Westhampton, MA
2013 Rank: 68
Enrollment (2010–2011): 756
Testing
Proficient or Higher ENGLISH LANGUAGE ARTS (ELA) 2011: 92%
Proficient or Higher MATH 2011: 87%
Proficient or Higher SCIENCE 2011: 84%
Average Total SAT Score: 1626
2014 performance at a glance
Student to Teacher Ratio (2010–2011): 12.3
4-Year Graduation Rates (2010): 94.1%
Spending per Student (2009–2010, by District): $14,281

Prev
Next
#68 Norwell High
Norwell High
Norwell, MA
2013 Rank: 75
Enrollment (2010–2011): 677
Testing
Proficient or Higher ENGLISH LANGUAGE ARTS (ELA) 2011: 99%
Proficient or Higher MATH 2011: 94%
Proficient or Higher SCIENCE 2011: 91%
Average Total SAT Score: 1619
2014 performance at a glance
Student to Teacher Ratio (2010–2011): 12.8
4-Year Graduation Rates (2010): 98.9%
Spending per Student (2009–2010, by District): $12,074
Prev
Next
#67 Innovation Academy Charter School
Innovation Academy Charter School (Charter)
Tyngsboro, MA
2013 Rank: 129
Enrollment (2010–2011): 321
Testing
Proficient or Higher ENGLISH LANGUAGE ARTS (ELA) 2011: 99%
Proficient or Higher MATH 2011: 88%
Proficient or Higher SCIENCE 2011: 86%
Average Total SAT Score: 1656
2014 performance at a glance
Student to Teacher Ratio (2010–2011): 11.7
4-Year Graduation Rates (2010): 93.9%
Spending per Student (2009–2010, by District): $11,786

Prev
Next
#66 Boston Latin Academy
Boston Latin Academy
Dorchester, MA
2013 Rank: 16
Enrollment (2010–2011): 1083
Testing
Proficient or Higher ENGLISH LANGUAGE ARTS (ELA) 2011: 100%
Proficient or Higher MATH 2011: 100%
Proficient or Higher SCIENCE 2011: 93%
Average Total SAT Score: 1613
2014 performance at a glance
Student to Teacher Ratio (2010–2011): 17.7
4-Year Graduation Rates (2010): 90.6%
Spending per Student (2009–2010, by District): $17,283

Prev
Next
#65 Marblehead High
Marblehead High
Marblehead, MA
2013 Rank: 43
Enrollment (2010–2011): 1053
Testing
Proficient or Higher ENGLISH LANGUAGE ARTS (ELA) 2011: 96%
Proficient or Higher MATH 2011: 92%
Proficient or Higher SCIENCE 2011: 88%
Average Total SAT Score: 1653
2014 performance at a glance
Student to Teacher Ratio (2010–2011): 13.2
4-Year Graduation Rates (2010): 96.7%
Spending per Student (2009–2010, by District): $12,998
Prev
Next
#64 Leominster High School & Center for
Leominster High School &Center for Technical Education
Leominster, MA
2013 Rank: 209
Enrollment (2010–2011): 34
Testing
Proficient or Higher ENGLISH LANGUAGE ARTS (ELA) 2011: 85%
Proficient or Higher MATH 2011: 82%
Proficient or Higher SCIENCE 2011: 75%
Average Total SAT Score: 1416
2014 performance at a glance
Student to Teacher Ratio (2010–2011):
4-Year Graduation Rates (2010): 92.6%
Spending per Student (2009–2010, by District): $12,233
Prev
Next
#63 Tantasqua Regional Sr. High
Tantasqua Regional Sr. High
Fiskdale, MA
2013 Rank: 96
Enrollment (2010–2011): 756
Testing
Proficient or Higher ENGLISH LANGUAGE ARTS (ELA) 2011: 97%
Proficient or Higher MATH 2011: 86%
Proficient or Higher SCIENCE 2011: 75%
Average Total SAT Score: 1607
2014 performance at a glance
Student to Teacher Ratio (2010–2011): 9.7
4-Year Graduation Rates (2010): 94.9%
Spending per Student (2009–2010, by District): $12,985

Prev
Next
#62 Groton Dunstable Regional
Groton Dunstable Regional
Groton, MA
2013 Rank: 87
Enrollment (2010–2011): 870
Testing
Proficient or Higher ENGLISH LANGUAGE ARTS (ELA) 2011: 99%
Proficient or Higher MATH 2011: 98%
Proficient or Higher SCIENCE 2011: 95%
Average Total SAT Score: 1664
2014 performance at a glance
Student to Teacher Ratio (2010–2011): 14.6
4-Year Graduation Rates (2010): 97%
Spending per Student (2009–2010, by District): $12,261
Prev
Next
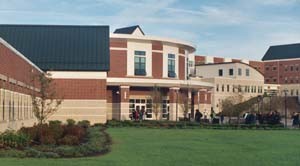
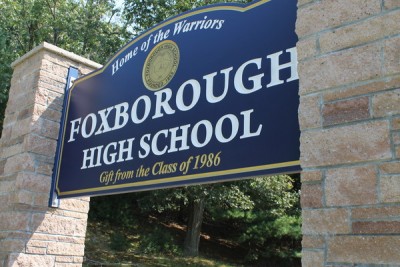
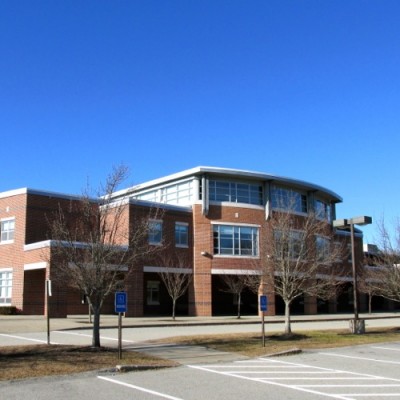
#61 Foxborough High
Foxborough High
Foxborough, MA
2013 Rank: 77
Enrollment (2010–2011): 855
Testing
Proficient or Higher ENGLISH LANGUAGE ARTS (ELA) 2011: 95%
Proficient or Higher MATH 2011: 88%
Proficient or Higher SCIENCE 2011: 90%
Average Total SAT Score: 1639
2014 performance at a glance
Student to Teacher Ratio (2010–2011): 12.9
4-Year Graduation Rates (2010): 97.2%
Spending per Student (2009–2010, by District): $13,635
Prev
Next
#60 Hingham High
Hingham High
Hingham, MA
2013 Rank: 63
Enrollment (2010–2011): 1132
Testing
Proficient or Higher ENGLISH LANGUAGE ARTS (ELA) 2011: 100%
Proficient or Higher MATH 2011: 95%
Proficient or Higher SCIENCE 2011: 94%
Average Total SAT Score: 1682
2014 performance at a glance
Student to Teacher Ratio (2010–2011): 14
4-Year Graduation Rates (2010): 96.7%
Spending per Student (2009–2010, by District): $11,415
Prev
Next
#59 North Shore Regional Vocational
North Shore Regional Vocational
Middleton, MA
2013 Rank: 72
Enrollment (2010–2011): 463
Testing
Proficient or Higher ENGLISH LANGUAGE ARTS (ELA) 2011: 96%
Proficient or Higher MATH 2011: 70%
Proficient or Higher SCIENCE 2011: 71%
Average Total SAT Score: 1338
2014 performance at a glance
Student to Teacher Ratio (2010–2011): 9.1
4-Year Graduation Rates (2010): 97.5%
Spending per Student (2009–2010, by District): $23,548
Prev
Next
#58 Framingham High School
Framingham High School
Framingham, MA
2013 Rank: 56
Enrollment (2010–2011): 2008
Testing
Proficient or Higher ENGLISH LANGUAGE ARTS (ELA) 2011: 94%
Proficient or Higher MATH 2011: 87%
Proficient or Higher SCIENCE 2011: 89%
Average Total SAT Score: 1592
2014 performance at a glance
Student to Teacher Ratio (2010–2011): 12
4-Year Graduation Rates (2010): 86.7%
Spending per Student (2009–2010, by District): $15,995
Prev
Next
#57 Smith Academy
Smith Academy
Hatfield, MA
2013 Rank: 81
Enrollment (2010–2011): 192
Testing
Proficient or Higher ENGLISH LANGUAGE ARTS (ELA) 2011: 95%
Proficient or Higher MATH 2011: 93%
Proficient or Higher SCIENCE 2011: 82%
Average Total SAT Score: 1619
2014 performance at a glance
Student to Teacher Ratio (2010–2011): 8.5
4-Year Graduation Rates (2010): 91.7%
Spending per Student (2009–2010, by District): $11,078

Prev
Next
#56 South Shore Charter Public School
South Shore Charter Public School
Norwell, MA
2013 Rank: 180
Enrollment (2010–2011): 171
Testing
Proficient or Higher ENGLISH LANGUAGE ARTS (ELA) 2011: 100%
Proficient or Higher MATH 2011: 93%
Proficient or Higher SCIENCE 2011: 88%
Average Total SAT Score: 1434
2014 performance at a glance
Student to Teacher Ratio (2010–2011): 11.3
4-Year Graduation Rates (2010): 93.9%
Spending per Student (2009–2010, by District): $18,301

Prev
Next
#55 Minuteman Regional Vocational Techni
Minuteman Regional Vocational Technical
Lexington, MA
2013 Rank: 40
Enrollment (2010–2011): 715
Testing
Proficient or Higher ENGLISH LANGUAGE ARTS (ELA) 2011: 95%
Proficient or Higher MATH 2011: 70%
Proficient or Higher SCIENCE 2011: 66%
Average Total SAT Score: 1384
2014 performance at a glance
Student to Teacher Ratio (2010–2011): 9
4-Year Graduation Rates (2010): 81.1%
Spending per Student (2009–2010, by District): $24,378
Prev
Next
#54 Pioneer Valley Performing Art Charte
Pioneer Valley Performing Art Charter Public School (Charter)
South Hadley, MA
2013 Rank: 91
Enrollment (2010–2011): 270
Testing
Proficient or Higher ENGLISH LANGUAGE ARTS (ELA) 2011: 99%
Proficient or Higher MATH 2011: 81%
Proficient or Higher SCIENCE 2011: 80%
Average Total SAT Score: 1644
2014 performance at a glance
Student to Teacher Ratio (2010–2011): 9.9
4-Year Graduation Rates (2010): 86.7%
Spending per Student (2009–2010, by District): $13,310

Prev
Next
#53 Hopkinton High
Hopkinton High
Hopkinton, MA
2013 Rank: 36
Enrollment (2010–2011): 1150
Testing
Proficient or Higher ENGLISH LANGUAGE ARTS (ELA) 2011: 98%
Proficient or Higher MATH 2011: 95%
Proficient or Higher SCIENCE 2011: 93%
Average Total SAT Score: 1688
2014 performance at a glance
Student to Teacher Ratio (2010–2011): 14.5
4-Year Graduation Rates (2010): 99.2%
Spending per Student (2009–2010, by District): $12,472
Prev
Next
#52 Newburyport High
Newburyport High
Newburyport, MA
2013 Rank: 39
Enrollment (2010–2011): 744
Testing
Proficient or Higher ENGLISH LANGUAGE ARTS (ELA) 2011: 97%
Proficient or Higher MATH 2011: 94%
Proficient or Higher SCIENCE 2011: 87%
Average Total SAT Score: 1622
2014 performance at a glance
Student to Teacher Ratio (2010–2011): 12.2
4-Year Graduation Rates (2010): 95.2%
Spending per Student (2009–2010, by District): $13,622

Prev
Next
#51 Monument Mt. Regional High School
Monument Mt. Regional High School
Great Barrington, MA
2013 Rank: 53
Enrollment (2010–2011): 566
Testing
Proficient or Higher ENGLISH LANGUAGE ARTS (ELA) 2011: 94%
Proficient or Higher MATH 2011: 89%
Proficient or Higher SCIENCE 2011: 87%
Average Total SAT Score: 1606
2014 performance at a glance
Student to Teacher Ratio (2010–2011): 12.2
4-Year Graduation Rates (2010): 92%
Spending per Student (2009–2010, by District): $15,632
Prev
Next
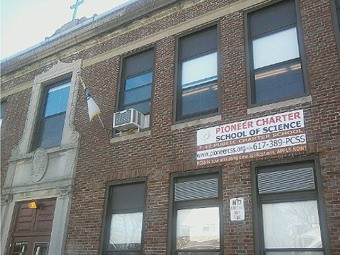
#50 Pioneer Charter School of Science
Pioneer Charter School of Science (Charter)
Everett, MA
2013 Rank: 235
Enrollment (2010–2011): 1100
Testing
Proficient or Higher ENGLISH LANGUAGE ARTS (ELA) 2011: 100%
Proficient or Higher MATH 2011: 95%
Proficient or Higher SCIENCE 2011: 98%
Average Total SAT Score: 1589
2014 performance at a glance
Student to Teacher Ratio (2010–2011): 11.2
4-Year Graduation Rates (2010): 95.7%
Spending per Student (2009–2010, by District): $12,261
Prev
Next
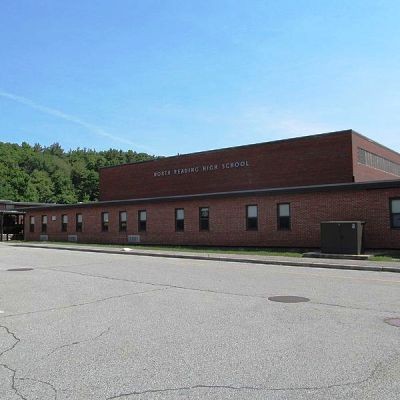
#49 North Reading High
North Reading High
North Reading, MA
2013 Rank: 58
Enrollment (2010–2011): 755
Testing
Proficient or Higher ENGLISH LANGUAGE ARTS (ELA) 2011: 98%
Proficient or Higher MATH 2011: 91%
Proficient or Higher SCIENCE 2011: 91%
Average Total SAT Score: 1670
2014 performance at a glance
Student to Teacher Ratio (2010–2011): 12.3
4-Year Graduation Rates (2010): 92.4%
Spending per Student (2009–2010, by District): $12,498
Prev
Next
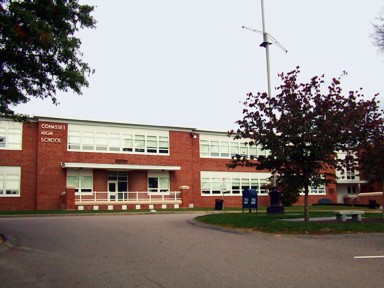
#48 Cohasset Middle/High School
Cohasset Middle/High School
Cohasset, MA
2013 Rank: 30
Enrollment (2010–2011): 399
Testing
Proficient or Higher ENGLISH LANGUAGE ARTS (ELA) 2011: 100%
Proficient or Higher MATH 2011: 95%
Proficient or Higher SCIENCE 2011: 81%
Average Total SAT Score: 1658
2014 performance at a glance
Student to Teacher Ratio (2010–2011): 13.1
4-Year Graduation Rates (2010): 95.6%
Spending per Student (2009–2010, by District): $13,524
Prev
Next
#47 Bristol County Agricultural High
Bristol County Agricultural High
Dighton, MA
2013 Rank: 230
Enrollment (2010–2011): 451
Testing
Proficient or Higher ENGLISH LANGUAGE ARTS (ELA) 2011: 100%
Proficient or Higher MATH 2011: 96%
Proficient or Higher SCIENCE 2011: 91%
Average Total SAT Score: 1439
2014 performance at a glance
Student to Teacher Ratio (2010–2011): 13.1
4-Year Graduation Rates (2010): 98.1%
Spending per Student (2009–2010, by District): $19,695

Prev
Next
#46 Littleton High School
Littleton High School
Littleton, MA
2013 Rank: 35
Enrollment (2010–2011): 439
Testing
Proficient or Higher ENGLISH LANGUAGE ARTS (ELA) 2011: 99%
Proficient or Higher MATH 2011: 93%
Proficient or Higher SCIENCE 2011: 94%
Average Total SAT Score: 1730
2014 performance at a glance
Student to Teacher Ratio (2010–2011): 14.6
4-Year Graduation Rates (2010): 91.3%
Spending per Student (2009–2010, by District): $12,559

Prev
Next
#45 Belmont High
Belmont High
Belmont, MA
2013 Rank: 51
Enrollment (2010–2011): 1183
Testing
Proficient or Higher ENGLISH LANGUAGE ARTS (ELA) 2011: 99%
Proficient or Higher MATH 2011: 97%
Proficient or Higher SCIENCE 2011: 94%
Average Total SAT Score: 1769
2014 performance at a glance
Student to Teacher Ratio (2010–2011): 16.8
4-Year Graduation Rates (2010): 98.4%
Spending per Student (2009–2010, by District): $12,259

Prev
Next
#44 Duxbury High
Duxbury High
Duxbury, MA
2013 Rank: 54
Enrollment (2010–2011): 1037
Testing
Proficient or Higher ENGLISH LANGUAGE ARTS (ELA) 2011: 99%
Proficient or Higher MATH 2011: 97%
Proficient or Higher SCIENCE 2011: 94%
Average Total SAT Score: 1682
2014 performance at a glance
Student to Teacher Ratio (2010–2011): 13.5
4-Year Graduation Rates (2010): 98.8%
Spending per Student (2009–2010, by District): $11,825

Prev
Next
#43 Rockport High
Rockport High
Rockport, MA
2013 Rank: 62
Enrollment (2010–2011): 312
Testing
Proficient or Higher ENGLISH LANGUAGE ARTS (ELA) 2011: 99%
Proficient or Higher MATH 2011: 95%
Proficient or Higher SCIENCE 2011: 87%
Average Total SAT Score: 1568
2014 performance at a glance
Student to Teacher Ratio (2010–2011): 11.5
4-Year Graduation Rates (2010): 90.4%
Spending per Student (2009–2010, by District): $15,484

Prev
Next
#42 Mt Greylock Regional High
Mt Greylock Regional High
Williamstown, MA
2013 Rank: 24
Enrollment (2010–2011): 581
Testing
Proficient or Higher ENGLISH LANGUAGE ARTS (ELA) 2011: 98%
Proficient or Higher MATH 2011: 92%
Proficient or Higher SCIENCE 2011: 63%
Average Total SAT Score: 1595
2014 performance at a glance
Student to Teacher Ratio (2010–2011): 11.1
4-Year Graduation Rates (2010): 88.9%
Spending per Student (2009–2010, by District): $17,604
Prev
Next
#41 Boston Collegiate Charter School
Boston Collegiate Charter School (Charter)
Dorchester, MA
2013 Rank: 160
Enrollment (2010–2011): 252
Testing
Proficient or Higher ENGLISH LANGUAGE ARTS (ELA) 2011: 100%
Proficient or Higher MATH 2011: 100%
Proficient or Higher SCIENCE 2011: 90%
Average Total SAT Score: 1503
2014 performance at a glance
Student to Teacher Ratio (2010–2011): 10.2
4-Year Graduation Rates (2010): 76.7%
Spending per Student (2009–2010, by District): $17,283
Prev
Next
#40 Andover High
Andover High
Andover, MA
2013 Rank: 45
Enrollment (2010–2011): 1799
Testing
Proficient or Higher ENGLISH LANGUAGE ARTS (ELA) 2011: 99%
Proficient or Higher MATH 2011: 98%
Proficient or Higher SCIENCE 2011: 88%
Average Total SAT Score: 1719
2014 performance at a glance
Student to Teacher Ratio (2010–2011): 15
4-Year Graduation Rates (2010): 96.6%
Spending per Student (2009–2010, by District): $13,836
Prev
Next
#39 Norfolk County Agricultural
Norfolk County Agricultural
Walpole, MA
2013 Rank: 33
Enrollment (2010–2011): 476
Testing
Proficient or Higher ENGLISH LANGUAGE ARTS (ELA) 2011: 97%
Proficient or Higher MATH 2011: 88%
Proficient or Higher SCIENCE 2011: 85%
Average Total SAT Score: 1438
2014 performance at a glance
Student to Teacher Ratio (2010–2011): 10.8
4-Year Graduation Rates (2010): 100%
Spending per Student (2009–2010, by District): $20,424

Prev
Next
#38 Nauset Regional High
Nauset Regional High
North Eastham, MA
2013 Rank: 15
Enrollment (2010–2011): 1010
Testing
Proficient or Higher ENGLISH LANGUAGE ARTS (ELA) 2011: 98%
Proficient or Higher MATH 2011: 91%
Proficient or Higher SCIENCE 2011: 87%
Average Total SAT Score: 1612
2014 performance at a glance
Student to Teacher Ratio (2010–2011): 12.6
4-Year Graduation Rates (2010): 93.2%
Spending per Student (2009–2010, by District): $16,541

Prev
Next
#37 Frontier Regional
Frontier Regional
South Deerfield, MA
2013 Rank: 47
Enrollment (2010–2011): 619
Testing
Proficient or Higher ENGLISH LANGUAGE ARTS (ELA) 2011: 94%
Proficient or Higher MATH 2011: 93%
Proficient or Higher SCIENCE 2011: 88%
Average Total SAT Score: 1605
2014 performance at a glance
Student to Teacher Ratio (2010–2011): 10.9
4-Year Graduation Rates (2010): 92.9%
Spending per Student (2009–2010, by District): $16,058

Prev
Next
#36 Medfield Senior High
Medfield Senior High
Medfield, MA
2013 Rank: 31
Enrollment (2010–2011): 882
Testing
Proficient or Higher ENGLISH LANGUAGE ARTS (ELA) 2011: 98%
Proficient or Higher MATH 2011: 96%
Proficient or Higher SCIENCE 2011: 93%
Average Total SAT Score: 1761
2014 performance at a glance
Student to Teacher Ratio (2010–2011): 13.9
4-Year Graduation Rates (2010): 99.2%
Spending per Student (2009–2010, by District): $11,830

Prev
Next
#35 Manchester Essex Regional High Schoo
Manchester Essex Regional High School
Manchester, MA
2013 Rank: 32
Enrollment (2010–2011): 461
Testing
Proficient or Higher ENGLISH LANGUAGE ARTS (ELA) 2011: 98%
Proficient or Higher MATH 2011: 96%
Proficient or Higher SCIENCE 2011: 96%
Average Total SAT Score: 1677
2014 performance at a glance
Student to Teacher Ratio (2010–2011): 12.1
4-Year Graduation Rates (2010): 93%
Spending per Student (2009–2010, by District): $13,479
Prev
Next
#34 Westford Academy
Westford Academy
Westform, MA
2013 Rank: 44
Enrollment (2010–2011): 1648
Testing
Proficient or Higher ENGLISH LANGUAGE ARTS (ELA) 2011: 99%
Proficient or Higher MATH 2011: 97%
Proficient or Higher SCIENCE 2011: 96%
Average Total SAT Score: 1767
2014 performance at a glance
Student to Teacher Ratio (2010–2011): 13.9
4-Year Graduation Rates (2010): 98.6%
Spending per Student (2009–2010, by District): $11,449

Prev
Next
#33 Algonquin Regional High
Algonquin Regional High
Northborough, MA
2013 Rank: 42
Enrollment (2010–2011): 1471
Testing
Proficient or Higher ENGLISH LANGUAGE ARTS (ELA) 2011: 99%
Proficient or Higher MATH 2011: 95%
Proficient or Higher SCIENCE 2011: 96%
Average Total SAT Score: 1715
2014 performance at a glance
Student to Teacher Ratio (2010–2011): 14.3
4-Year Graduation Rates (2010): 97.5%
Spending per Student (2009–2010, by District): $13,900
Prev
Next
#32 Longmeadow High
Longmeadow High
Longmeadow, MA
2013 Rank: 18
Enrollment (2010–2011): 958
Testing
Proficient or Higher ENGLISH LANGUAGE ARTS (ELA) 2011: 100%
Proficient or Higher MATH 2011: 95%
Proficient or Higher SCIENCE 2011: 94%
Average Total SAT Score: 1697
2014 performance at a glance
Student to Teacher Ratio (2010–2011): 12.7
4-Year Graduation Rates (2010): 98.3%
Spending per Student (2009–2010, by District): $13,110

Prev
Next
#31 Hamilton-Wenham Regional High
Hamilton-Wenham Regional High
South Hamilton, MA
2013 Rank:
Enrollment (2010–2011): 675
Testing
Proficient or Higher ENGLISH LANGUAGE ARTS (ELA) 2011: 99%
Proficient or Higher MATH 2011: 95%
Proficient or Higher SCIENCE 2011: 94%
Average Total SAT Score: 1663
2014 performance at a glance
Student to Teacher Ratio (2010–2011): 12.6
4-Year Graduation Rates (2010): 95.3%
Spending per Student (2009–2010, by District): $14,759

Prev
Next
#30 Needham High
Needham High
Needham, MA
2013 Rank: 29
Enrollment (2010–2011): 1582
Testing
Proficient or Higher ENGLISH LANGUAGE ARTS (ELA) 2011: 99%
Proficient or Higher MATH 2011: 97%
Proficient or Higher SCIENCE 2011: 92%
Average Total SAT Score: 1760
2014 performance at a glance
Student to Teacher Ratio (2010–2011): 15.1
4-Year Graduation Rates (2010): 97.8%
Spending per Student (2009–2010, by District): $13,742

Prev
Next
#29 Winchester High School
Winchester High School
Winchester, MA
2013 Rank: 27
Enrollment (2010–2011): 1150
Testing
Proficient or Higher ENGLISH LANGUAGE ARTS (ELA) 2011: 99%
Proficient or Higher MATH 2011: 96%
Proficient or Higher SCIENCE 2011: 95%
Average Total SAT Score: 1773
2014 performance at a glance
Student to Teacher Ratio (2010–2011): 14
4-Year Graduation Rates (2010): 98.9%
Spending per Student (2009–2010, by District): $11,954
Prev
Next
#28 Westwood High
Westwood High
Westwood, MA
2013 Rank: 34
Enrollment (2010–2011): 935
Testing
Proficient or Higher ENGLISH LANGUAGE ARTS (ELA) 2011: 98%
Proficient or Higher MATH 2011: 96%
Proficient or Higher SCIENCE 2011: 93%
Average Total SAT Score: 1727
2014 performance at a glance
Student to Teacher Ratio (2010–2011): 13.7
4-Year Graduation Rates (2010): 98.2%
Spending per Student (2009–2010, by District): $14,197
Prev
Next
#27 Four Rivers Charter Public School
Four Rivers Charter Public School (Charter)
Greenfield, MA
2013 Rank: 50
Enrollment (2010–2011): 216
Testing
Proficient or Higher ENGLISH LANGUAGE ARTS (ELA) 2011: 100%
Proficient or Higher MATH 2011: 94%
Proficient or Higher SCIENCE 2011: 97%
Average Total SAT Score: 1692
2014 performance at a glance
Student to Teacher Ratio (2010–2011): 9.7
4-Year Graduation Rates (2010): 91.2%
Spending per Student (2009–2010, by District): $12,290

Prev
Next
#26 Westborough High
Westborough High
Westborough, MA
2013 Rank: 28
Enrollment (2010–2011): 1053
Testing
Proficient or Higher ENGLISH LANGUAGE ARTS (ELA) 2011: 97%
Proficient or Higher MATH 2011: 93%
Proficient or Higher SCIENCE 2011: 95%
Average Total SAT Score: 1716
2014 performance at a glance
Student to Teacher Ratio (2010–2011): 12.6
4-Year Graduation Rates (2010): 96.6%
Spending per Student (2009–2010, by District): $14,545
Prev
Next
#25 Acton-Boxborough Regional High
Acton-Boxborough Regional High
Acton, MA
2013 Rank: 23
Enrollment (2010–2011): 1960
Testing
Proficient or Higher ENGLISH LANGUAGE ARTS (ELA) 2011: 98%
Proficient or Higher MATH 2011: 99%
Proficient or Higher SCIENCE 2011: 97%
Average Total SAT Score: 1878
2014 performance at a glance
Student to Teacher Ratio (2010–2011): 16.1
4-Year Graduation Rates (2010): 97.9%
Spending per Student (2009–2010, by District): $11,669

Prev
Next
#24 Lenox Memorial High
Lenox Memorial High
Lenox, MA
2013 Rank: 17
Enrollment (2010–2011): 240
Testing
Proficient or Higher ENGLISH LANGUAGE ARTS (ELA) 2011: 100%
Proficient or Higher MATH 2011: 86%
Proficient or Higher SCIENCE 2011: 78%
Average Total SAT Score: 1669
2014 performance at a glance
Student to Teacher Ratio (2010–2011): 8.3
4-Year Graduation Rates (2010): 91.3%
Spending per Student (2009–2010, by District): $15,072
Prev
Next
#23 Prospect Hill Academy Charter School
Prospect Hill Academy Charter School (Charter)
Cambridge, MA
2013 Rank: 204
Enrollment (2010–2011): 282
Testing
Proficient or Higher ENGLISH LANGUAGE ARTS (ELA) 2011: 100%
Proficient or Higher MATH 2011: 90%
Proficient or Higher SCIENCE 2011: 75%
Average Total SAT Score: 1438
2014 performance at a glance
Student to Teacher Ratio (2010–2011): 12.3
4-Year Graduation Rates (2010): 86.5%
Spending per Student (2009–2010, by District): $27,018

Prev
Next
#22 Essex Agricultural and Technical Ins
Essex Agricultural and Technical Insititute
Hathorne, MA
2013 Rank: 89
Enrollment (2010–2011): 472
Testing
Proficient or Higher ENGLISH LANGUAGE ARTS (ELA) 2011: 100%
Proficient or Higher MATH 2011: 89%
Proficient or Higher SCIENCE 2011: 93%
Average Total SAT Score: 1409
2014 performance at a glance
Student to Teacher Ratio (2010–2011): 9.6
4-Year Graduation Rates (2010): 97.4%
Spending per Student (2009–2010, by District): $23,004

Prev
Next
#21 Sturgis Charter Public School
Sturgis Charter Public School
Hyannis, MA
2013 Rank: 38
Enrollment (2010–2011): 803
Testing
Proficient or Higher ENGLISH LANGUAGE ARTS (ELA) 2011: 100%
Proficient or Higher MATH 2011: 96%
Proficient or Higher SCIENCE 2011: 95%
Average Total SAT Score: 1690
2014 performance at a glance
Student to Teacher Ratio (2010–2011): 9.7
4-Year Graduation Rates (2010): 92.3%
Spending per Student (2009–2010, by District): $13,564

Prev
Next
#20 Boston Latin
Boston Latin
Boston, MA
2013 Rank: 16
Enrollment (2010–2011): 1582
Testing
Proficient or Higher ENGLISH LANGUAGE ARTS (ELA) 2011: 100%
Proficient or Higher MATH 2011: 100%
Proficient or Higher SCIENCE 2011: 100%
Average Total SAT Score: 1869
2014 performance at a glance
Student to Teacher Ratio (2010–2011): 20.2
4-Year Graduation Rates (2010): 98.6%
Spending per Student (2009–2010, by District): $17,283
Prev
Next
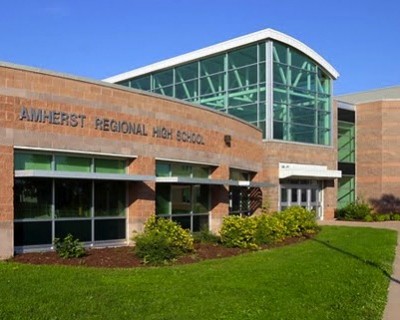
#19 Amherst Regional High
Amherst Regional High
Amherst, MA
2013 Rank: 21
Enrollment (2010–2011): 1004
Testing
Proficient or Higher ENGLISH LANGUAGE ARTS (ELA) 2011: 95%
Proficient or Higher MATH 2011: 88%
Proficient or Higher SCIENCE 2011: 89%
Average Total SAT Score: 1741
2014 performance at a glance
Student to Teacher Ratio (2010–2011): 12.7
4-Year Graduation Rates (2010): 91.3%
Spending per Student (2009–2010, by District): $18,026
Prev
Next
#18 Bedford High
Bedford High
Bedford, MA
2013 Rank: 12
Enrollment (2010–2011): 902
Testing
Proficient or Higher ENGLISH LANGUAGE ARTS (ELA) 2011: 100%
Proficient or Higher MATH 2011: 94%
Proficient or Higher SCIENCE 2011: 87%
Average Total SAT Score: 1711
2014 performance at a glance
Student to Teacher Ratio (2010–2011): 12
4-Year Graduation Rates (2010): 95.7%
Spending per Student (2009–2010, by District): $16,600
Prev
Next
#17 Francis W. Parker Charter Essential
Francis W. Parker Charter Essential School
Devens, MA
2013 Rank: 37
Enrollment (2010–2011): 399
Testing
Proficient or Higher ENGLISH LANGUAGE ARTS (ELA) 2011: 98%
Proficient or Higher MATH 2011: 91%
Proficient or Higher SCIENCE 2011: 88%
Average Total SAT Score: 1712
2014 performance at a glance
Student to Teacher Ratio (2010–2011): 8.4
4-Year Graduation Rates (2010): 92.9%
Spending per Student (2009–2010, by District): $13,984
Prev
Next
#16 Sharon High
Sharon High
Sharon, MA
2013 Rank: 20
Enrollment (2010–2011): 1142
Testing
Proficient or Higher ENGLISH LANGUAGE ARTS (ELA) 2011: 99%
Proficient or Higher MATH 2011: 97%
Proficient or Higher SCIENCE 2011: 93%
Average Total SAT Score: 1789
2014 performance at a glance
Student to Teacher Ratio (2010–2011): 12.9
4-Year Graduation Rates (2010): 97.1%
Spending per Student (2009–2010, by District): $14,527
Prev
Next
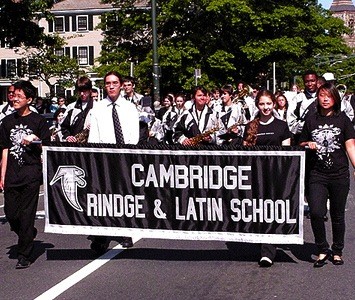
#15 Cambridge Rindge and Latin
Cambridge Rindge and Latin
Cambridge, MA
2013 Rank: 10
Enrollment (2010–2011): 1741
Testing
Proficient or Higher ENGLISH LANGUAGE ARTS (ELA) 2011: 91%
Proficient or Higher MATH 2011: 85%
Proficient or Higher SCIENCE 2011: 70%
Average Total SAT Score: 1502
2014 performance at a glance
Student to Teacher Ratio (2010–2011): 10.1
4-Year Graduation Rates (2010): 87.3%
Spending per Student (2009–2010, by District): $27,018

Prev
Next
#14 Newton North High
Newton North High
Newtonville, MA
2013 Rank: 8
Enrollment (2010–2011): 1990
Testing
Proficient or Higher ENGLISH LANGUAGE ARTS (ELA) 2011: 97%
Proficient or Higher MATH 2011: 92%
Proficient or Higher SCIENCE 2011: 88%
Average Total SAT Score: 1754
2014 performance at a glance
Student to Teacher Ratio (2010–2011): 12
4-Year Graduation Rates (2010): 95.4%
Spending per Student (2009–2010, by District): $16,400
Prev
Next
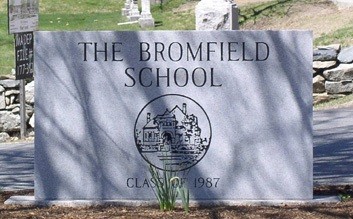
#13 Bromfield
Bromfield
Harvard, MA
2013 Rank: 26
Enrollment (2010–2011): 709
Testing
Proficient or Higher ENGLISH LANGUAGE ARTS (ELA) 2011: 100%
Proficient or Higher MATH 2011: 97%
Proficient or Higher SCIENCE 2011: 97%
Average Total SAT Score: 1824
2014 performance at a glance
Student to Teacher Ratio (2010–2011): 13.8
4-Year Graduation Rates (2010): 98.3%
Spending per Student (2009–2010, by District): $13,984
Prev
Next
#12 Brookline High
Brookline High
Brookline, MA
2013 Rank: 11
Enrollment (2010–2011): 1832
Testing
Proficient or Higher ENGLISH LANGUAGE ARTS (ELA) 2011: 98%
Proficient or Higher MATH 2011: 93%
Proficient or Higher SCIENCE 2011: 87%
Average Total SAT Score: 1790
2014 performance at a glance
Student to Teacher Ratio (2010–2011): 12.6
4-Year Graduation Rates (2010): 93.5%
Spending per Student (2009–2010, by District): $16,626

Prev
Next
#11 Community Charter School of Cambridg
Community Charter School of Cambridge (Charter)
Cambridge, MA
2013 Rank: 148
Enrollment (2010–2011): 377
Testing
Proficient or Higher ENGLISH LANGUAGE ARTS (ELA) 2011: 100%
Proficient or Higher MATH 2011: 90%
Proficient or Higher SCIENCE 2011: 84%
Average Total SAT Score: 1436
2014 performance at a glance
Student to Teacher Ratio (2010–2011): 9.9
4-Year Graduation Rates (2010): 88.2%
Spending per Student (2009–2010, by District): $27,018
Prev
Next
#10 Lincoln-Sudbury Regional High
Lincoln-Sudbury Regional High
Sudbury, MA
2013 Rank: 14
Enrollment (2010–2011): 1641
Mascot: Warriors
Claim to fame: Famous alums include Mike Gordon, member of the band Phish;Robert Kirshner, astrophysicist and author.
Testing
Proficient or Higher ENGLISH LANGUAGE ARTS (ELA) 2011: 98%
Proficient or Higher MATH 2011: 93%
Proficient or Higher SCIENCE 2011: 85%
Average Total SAT Score: 1803
2014 performance at a glance
Student to Teacher Ratio (2010–2011): 13.5
4-Year Graduation Rates (2010): 98.7%
Spending per Student (2009–2010, by District): $17,340

Prev
Next
#9 Wellesley Sr High
Wellesley Sr High
Wellesley, MA
2013 Rank: 5
Enrollment (2010–2011): 1434
Mascot: Raider
Claim to fame: Famous alums include Biz Stone, Co-founder of Twitter;Aneesh Raman;presidential speechwriter.
Testing
Proficient or Higher ENGLISH LANGUAGE ARTS (ELA) 2011: 100%
Proficient or Higher MATH 2011: 98%
Proficient or Higher SCIENCE 2011: 82%
Average Total SAT Score: 1822
2014 performance at a glance
Student to Teacher Ratio (2010–2011): 12.3
4-Year Graduation Rates (2010): 98.6%
Spending per Student (2009–2010, by District): $15,085
Prev
Next
#8 Wayland High School
Wayland High School
Wayland, MA
2013 Rank: 13
Enrollment (2010–2011): 842
Mascot: Warriors
Claim to fame: Famous alums include Elliot Francis, Television/Radio news anchor;Alberto Salazar;winner of the Boston and New York Marathons.
Testing
Proficient or Higher ENGLISH LANGUAGE ARTS (ELA) 2011: 99%
Proficient or Higher MATH 2011: 95%
Proficient or Higher SCIENCE 2011: 89%
Average Total SAT Score: 1796
2014 performance at a glance
Student to Teacher Ratio (2010–2011): 12.2
4-Year Graduation Rates (2010): 99.1%
Spending per Student (2009–2010, by District): $15,902
Prev
Next
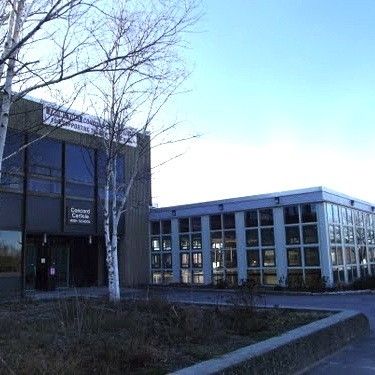
#7 Concord Carlisle High
Concord Carlisle High
Concord, MA
2013 Rank: 4
Enrollment (2010–2011): 1228
Mascot: Patriot
Claim to fame: Notable alums include John Tortorella, Head Coach of the New York Rangers;Chester G. Atkins, former Congressman;Ted Sarandis, sports radio host.
Testing
Proficient or Higher ENGLISH LANGUAGE ARTS (ELA) 2011: 99%
Proficient or Higher MATH 2011: 95%
Proficient or Higher SCIENCE 2011: 96%
Average Total SAT Score: 1807
2014 performance at a glance
Student to Teacher Ratio (2010–2011): 13.5
4-Year Graduation Rates (2010): 98%
Spending per Student (2009–2010, by District): $16,893
Prev
Next
#6 AMSA Charter
Advanced Math and Science Academy Charter School (Charter)
Marlborough, MA
2013 Rank: 19
Enrollment (2010–2011): 567
Mascot: War Eagle
Claim to fame: This school consistently scores in the highest percentile among Massachusetts schools in the English, Math and Science MCAS exams.
Testing
Proficient or Higher ENGLISH LANGUAGE ARTS (ELA) 2011: 100%
Proficient or Higher MATH 2011: 100%
Proficient or Higher SCIENCE 2011: 98%
Average Total SAT Score: 1825
2014 performance at a glance
Student to Teacher Ratio (2010–2011): 11.5
4-Year Graduation Rates (2010): 98.6%
Spending per Student (2009–2010, by District): $14,198
Prev
Next
#5 Newton South High
Newton South High
Newton Centre, MA
2013 Rank: 9
Enrollment (2010–2011): 1779
Mascot: Lions
Claim to fame: Famous alums include John Krasinski, actor;BJ Novak, actor;Eli Roth, actor and director.
Testing
Proficient or Higher ENGLISH LANGUAGE ARTS (ELA) 2011: 99%
Proficient or Higher MATH 2011: 96%
Proficient or Higher SCIENCE 2011: 89%
Average Total SAT Score: 1857
2014 performance at a glance
Student to Teacher Ratio (2010–2011): 12.4
4-Year Graduation Rates (2010): 98.1%
Spending per Student (2009–2010, by District): $16,400
Prev
Next
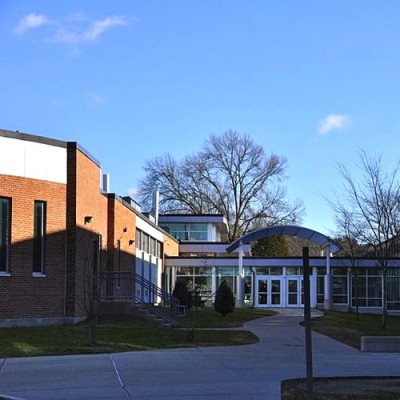
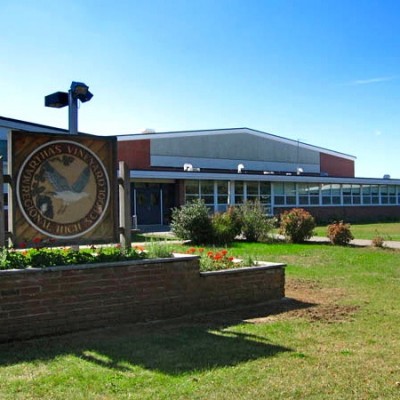
#4 Marthas Vineyard Regional High
Marthas Vineyard Regional High
Oak Bluffs, MA
2013 Rank: 6
Enrollment (2010–2011): 687
Mascot: Vineyarders
Claim to fame: Famous alums include Tim Burton, member of the Mighty Mighty Bosstones;Willy Mason, musician, songwriter and radio host.
Testing
Proficient or Higher ENGLISH LANGUAGE ARTS (ELA) 2011: 96%
Proficient or Higher MATH 2011: 88%
Proficient or Higher SCIENCE 2011: 86%
Average Total SAT Score: 1600
2014 performance at a glance
Student to Teacher Ratio (2010–2011): 9
4-Year Graduation Rates (2010): 91.7%
Spending per Student (2009–2010, by District): $25,125

Prev
Next
#3 Dover-Sherborn Regional High
Dover-Sherborn Regional High
North Dighton, MA
2013 Rank: 2
Enrollment (2010–2011): 642
Mascot: Raiders
Claim to fame: Famous alumni include Chad Urmston, singer songwriter of Dispatch and State Radio;Kenny Florian, UFC Fighter.
Testing
Proficient or Higher ENGLISH LANGUAGE ARTS (ELA) 2011: 100%
Proficient or Higher MATH 2011: 99%
Proficient or Higher SCIENCE 2011: 99%
Average Total SAT Score: 1843
2014 performance at a glance
Student to Teacher Ratio (2010–2011): 11.5
4-Year Graduation Rates (2010): 98.1%
Spending per Student (2009–2010, by District): $16,434
Prev
Next
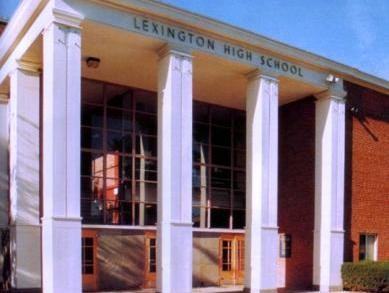
#2 Lexington High
Lexington High
Lexington, MA
2013 Rank: 3
Enrollment (2010–2011): 2002
Mascot: Minutemen
Claim to fame: Famous Alums include Matt Nathanson, singer-songwriter;Lev Grossman, Novelist and Senior Writer at Time Magazine;Zachary Lemnios, Assistant Secretary of Defense.
Testing
Proficient or Higher ENGLISH LANGUAGE ARTS (ELA) 2011: 99%
Proficient or Higher MATH 2011: 97%
Proficient or Higher SCIENCE 2011: 96%
Average Total SAT Score: 1905
2014 performance at a glance
Student to Teacher Ratio (2010–2011): 12.6
4-Year Graduation Rates (2010): 97.4%
Spending per Student (2009–2010, by District): $16,726

Prev
Next
#1 Weston High
Weston High
Weston, MA
2013 Rank: 1
Enrollment (2010–2011): 778
Mascot: Wildcats
Claim to fame: This school ranked 60th among the best high schools in the United States in the 2008 U.S. News & World Report list.
Related Articles
Enjoy this post? Share it with others.
Email to a friend
Permalink


Follow us on Pinterest Google + Facebook Twitter See It Read It