John Monfredo: Worcester Continues Its Crusade to Address Bullying


 Email to a friend
Permalink
Email to a friend
Permalink
Friday, May 09, 2014
John Monfredo, GoLocalWorcester MINDSETTER

Please remember bullying is not just a problem in poor schools, nor is it confined to a particular ethnic group. It’s universal, believes John Monfredo.
Just recently the Worcester Public Schools “Safe and Secure Environment Committee” held a workshop for parents, students and the community to hear more about the “Bullying Prevention and Intervention Plan. Remember, the State of Massachusetts does have a mandatory Bullying Law. However, it was not until two deaths occurred by suicide did a law finally pass. It took the tragedies at South Hadley and the Springfield Charter School for State officials to take notice about the need to push forward legislation to deal with this problem. Sadly, Massachusetts had been one of six states lacking a specific law targeting school bullying but now we finally have a most comprehensive law to protect our children.
Ahead of the curve
The Worcester Public Schools has been ahead of the curve on this issue and continues to use the law to remind students and parents what to do if bullying occurs. The Worcester Public Schools plan has a Statement of Purpose and has made it perfectly clear that this school system will not tolerate any form of bullying.
The purpose is stated as follows:
The Worcester Public Schools Bullying Prevention and Intervention Plan is a comprehensive approach to addressing bullying and cyber-bullying. Worcester Public Schools are committed to working with students, staff, families, law enforcement agencies, and the community to prevent issues of violence. In consultation with these constituencies, we have established this Plan for preventing, intervening, and responding to incidents of bullying, cyber-bullying, and retaliation. The district takes seriously its responsibility for the implementation of the Plan to ensure students are safeguarded from bullying.
The district is committed to providing all students with a safe learning environment that is free from in-person bullying and cyber-bullying. This commitment is an integral part of our comprehensive efforts to promote learning, and to prevent and eliminate all forms of bullying and other harmful and disruptive behavior that can impede the learning process and outstanding results for all students.
The Worcester Public Schools will not tolerate any unlawful or disruptive behavior, including any form of bullying, cyber-bullying, or retaliation, in Worcester Public Schools buildings, on school grounds, or in school-related activities. We will investigate all reports and complaints of bullying, cyber-bullying, and retaliation, and take immediate action to end bullying behavior and restore the victim’s sense of safety. We will support this commitment in all aspects of our school community, the curriculum, instructional programs, staff development, and extracurricular activities, and engage parents/guardians to support bullying prevention.
Robert Pezzella, School Safety Liaison, greeting the audience and reminded everyone about the importance of the law and the need to work as a community to “stamp” out bullying. In a slide presentation he reminded everyone about the definition of bullying… The repeated use by one or more students of written, verbal or electronic expression of a physical act or gesture of any combination thereof, directed at a victim that:
- Causes physical or emotional harm to the target or damage to the target’s property;
- Places the target in reasonable fear or harm to himself or of damage to his property;
- Creates a hostile environment at school; or
- Disrupts the education process or the orderly operation of a school. Bullying shall include cyber bullying;
- Cyber-bullying through the use of technology or any electronic communication, which includes any transfer of signs, signals, writing, images, sounds, data of any nature transmitted through electronic mail, internet communications, instant messages or fax communications.
- Cyber bullying includes the creation of web pages or blog in which the creator assumes the identity of another person or the knowing impersonation of another person as the author of posted content and messages.
Other issues addressed were retaliation for anyone reporting acts of bullying and the role of bystanders in bullying issues. It was noted that bystanders have the power to drastically reduce bullying at schools and it’s something that needs to be addressed over and over again. When the issue of “ratting out and snitching” came up it was pointed out that “Tattling, ratting out, snitching is telling to get someone in trouble, where as reporting is telling to get someone out of trouble. The bystander needs to be part of the solution for we can’t let the bully get away with these unkind acts.
What you can do
The parents and the students in the audience were reminded that they can report bullying to any staff member for staff has a responsibility to report bullying to administration. It was recommended that you go to your principal first. There is also an incident reporting form that is available in the main office of each school, counseling office, nurse’s office, and on the Worcester Public Schools webpage.
You can also mail in your bullying complaint to Robert Pezzela, Safety Liaison Office at the Worcester Public Schools Durkin Administration Building at 20 Irving Street Worcester, MA. 01609. You can email the report to [email protected] or call the anonymous tip line … 508 799-3472.
The Worcester Public Schools Bullying Intervention and Prevention Plan is available in seven languages and as a reminder on the issue of bullying all schools have posters on display throughout the building.
The system has started a new program last year called I SAFE and Dante Quercio the district Online Instructional Coach spoke about the program. In essence, the program is a blended compliance enterprise solution that combines the power of technology, traditional curriculum and the influence of social media to educate and empower students through cutting-edge safety platforms. The program is attempting to give students tools for equipping them with critical thinking and decision –making skills they need to be safe, responsible and technology proficient cyber citizens in today’s global society. According to Mr. Querico, the idea is to start teaching at a young age about being safe and responsible when using the internet. This way as the students grow older they will less likely be vulnerable to a threat or do something irresponsible.
The golden rule
As stated at the workshop… follow the golden rule. “ Treat others the way you would like to be treated. Stand up for someone when he or she needs it, and when you need it someone will stand up for you.”
Let’s remember that any program on bullying is only a beginning for we can’t have any “end date” for bullying prevention activities. Please remember bullying is not just a problem in poor schools, nor is it confined to a particular ethnic group. It’s universal. As difficult and widespread a problem as bullying is it is also a problem that can be solved. Research from across the nation shows that when schools take specific action, bullying can be eliminated.
Related Slideshow: The 50 Most Diverse High Schools in Massachusetts

Prev
Next
#50 Curtis-Tufts HS
Medford, MA
Total enrollment: 67
Percentage of total enrollment
Amer Indian/Alaskan: 0.0%
Asian/Pacific Islander: 4.5%
Black: 27.3%
Hispanic: 13.6%
Two or more races: 0.0%
White: 54.5%

Prev
Next
#49 Boston Green Acad.
Boston Green Acad. Horace Mann Charter, Boston, MA
Total enrollment: 324
Percentage of total enrollment
Amer Indian/Alaskan: 0.3%
Asian/Pacific Islander: 2.8%
Black: 53.1%
Hispanic: 28.4%
Two or more races: 0.3%
White: 15.1%

Prev
Next
#48 Fitchburg HS
Fitchburg, MA
Total enrollment: 1,116
Percentage of total enrollment
Amer Indian/Alaskan: 0.1%
Asian/Pacific Islander: 7.0%
Black: 7.3%
Hispanic: 44.8%
Two or more races: 4.1%
White: 36.6%

Prev
Next
#47 Global Learning
Global Learning Charter Public HS, New Bedford, MA
Total enrollment: 501
Percentage of total enrollment
Amer Indian/Alaskan: 0.8%
Asian/Pacific Islander: 1.0%
Black: 12.6%
Hispanic: 27.9%
Two or more races: 4.2%
White: 53.5%

Prev
Next
#46 Lowell Middlesex
Lowell Middlesex Acad. Charter HS, Lowell, MA
Total enrollment: 99
Percentage of total enrollment
Amer Indian/Alaskan: 0.0%
Asian/Pacific Islander: 11.1%
Black: 2.0%
Hispanic: 38.4%
Two or more races: 5.1%
White: 42.4%

Prev
Next
#45 Community Academy
Jamaica Plain, MA
Total enrollment: 67
Percentage of total enrollment
Amer Indian/Alaskan: 0.0%
Asian/Pacific Islander: 0.0%
Black: 40.3%
Hispanic: 16.4%
Two or more races: 3.0%
White: 40.3%

Prev
Next
#44 Quincy HS
Quincy, MA
Total enrollment: 1,519
Percentage of total enrollment
Amer Indian/Alaskan: 0.7%
Asian/Pacific Islander: 23.9%
Black: 9.8%
Hispanic: 7.4%
Two or more races: 1.8%
White: 56.3%

Prev
Next
#43 Foxborough Regional
Foxborough Reg. Charter HS, Foxborough, MA
Total enrollment: 1,265
Percentage of total enrollment
Amer Indian/Alaskan: 0.0%
Asian/Pacific Islander: 10.4%
Black: 23.8%
Hispanic: 5.1%
Two or more races: 4.5%
White: 56.3%

Prev
Next
#42 Boston Collegiate
Boston Collegiate Charter HS, Dorchester, MA
Total enrollment: 632
Percentage of total enrollment
Amer Indian/Alaskan: 0.3%
Asian/Pacific Islander: 1.9%
Black: 25.5%
Hispanic: 15.7%
Two or more races: 2.2%
White: 54.4%

Prev
Next
#41 Full Circle HS
Somerville, MA
Total enrollment: 56
Percentage of total enrollment
Amer Indian/Alaskan: 0.0%
Asian/Pacific Islander: 1.8%
Black: 21.4%
Hispanic: 35.7%
Two or more races: 1.8%
White: 39.3%

Prev
Next
#40 Waltham Senior HS
Waltham, MA
Total enrollment: 1,389
Percentage of total enrollment
Amer Indian/Alaskan: 0.1%
Asian/Pacific Islander: 6.4%
Black: 11.2%
Hispanic: 30.6%
Two or more races: 2.6%
White: 49.1%

Prev
Next
#39 Medford HS
Medford MA
Total enrollment: 1,155
Percentage of total enrollment
Amer Indian/Alaskan: 0.3%
Asian/Pacific Islander: 10.0%
Black: 18.4%
Hispanic: 8.2%
Two or more races: 1.9%
White: 61.9%

Prev
Next
#38 Snowden International
Snowden Int'l School at Copley, Boston, MA
Total enrollment: 397
Percentage of total enrollment
Amer Indian/Alaskan: 0.3%
Asian/Pacific Islander: 7.6%
Black: 38.3%
Hispanic: 41.3%
Two or more races: 3.0%
White: 9.6%

Prev
Next
#37 Brockton HS
Brockton Champion HS, Brockton, MA
Total enrollment: 194
Percentage of total enrollment
Amer Indian/Alaskan: 0.5%
Asian/Pacific Islander: 1.0%
Black: 41.2%
Hispanic: 19.6%
Two or more races: 2.6%
White: 35.1%

Prev
Next
#36 Worcester Tech. HS
Worcester, MA
Total enrollment: 1,358
Percentage of total enrollment
Amer Indian/Alaskan: 0.5%
Asian/Pacific Islander: 5.8%
Black: 12.4%
Hispanic: 34.6%
Two or more races: 2.2%
White: 44.5%

Prev
Next
#35 Acad. of the Pac. Rim
Acad. of the Pac. Rim Charter Public HS, Hyde Park MA
Total enrollment: 498
Percentage of total enrollment
Amer Indian/Alaskan: 0.0%
Asian/Pacific Islander: 1.4%
Black: 58.4%
Hispanic: 20.5%
Two or more races: 3.4%
White: 16.3%

Prev
Next
#34 Lynn Vocational
Lynn Vocational Tech. Institute, Lynn, MA
Total enrollment: 750
Percentage of total enrollment
Amer Indian/Alaskan: 0.8%
Asian/Pacific Islander: 6.7%
Black: 10.7%
Hispanic: 60.0%
Two or more races: 2.9%
White: 18.9%

Prev
Next
#33 Boston Arts Academy
Boston, MA
Total enrollment: 445
Percentage of total enrollment
Amer Indian/Alaskan: 0.4%
Asian/Pacific Islander: 3.1%
Black: 38.7%
Hispanic: 40.0%
Two or more races: 2.2%
White: 15.5%

Prev
Next
#32 Greater Lowell
Greater Lowell Reg. Vocational Tech., Tyngsborough, MA
Total enrollment: 2,112
Percentage of total enrollment
Amer Indian/Alaskan: 0.5%
Asian/Pacific Islander: 14.8%
Black: 3.9%
Hispanic: 26.6%
Two or more races: 2.6%
White: 51.7%
Prev
Next
#31 Amherst Regional HS
Amherst, MA
Total enrollment: 1,004
Percentage of total enrollment
Amer Indian/Alaskan: 0.1%
Asian/Pacific Islander: 10.0%
Black: 8.3%
Hispanic: 12.2%
Two or more races: 8.4%
White: 61.2%

Prev
Next
#30 Horace Mann
Horace Mann School for the Deaf, Allston, MA
Total enrollment: 111
Percentage of total enrollment
Amer Indian/Alaskan: 0.0%
Asian/Pacific Islander: 9.0%
Black: 36.0%
Hispanic: 41.4%
Two or more races: 1.8%
White: 11.7%

Prev
Next
#29 Everett HS
Everett, MA
Total enrollment: 2,004
Percentage of total enrollment
Amer Indian/Alaskan: 0.3%
Asian/Pacific Islander: 4.9%
Black: 23.9%
Hispanic: 32.4%
Two or more races: 1.0%
White: 37.5%

Prev
Next
#28 Lynn English HS
Lynn, MA
Total enrollment: 1,611
Percentage of total enrollment
Amer Indian/Alaskan: 0.1%
Asian/Pacific Islander: 9.9%
Black: 10.8%
Hispanic: 53.0%
Two or more races: 2.2%
White: 24.0%
Prev
Next
#27 Boston Latin HS
Boston, MA
Total enrollment: 2,379
Percentage of total enrollment
Amer Indian/Alaskan: 0.0%
Asian/Pacific Islander: 29.1%
Black: 9.5%
Hispanic: 10.6%
Two or more races: 3.1%
White: 47.7%
Prev
Next
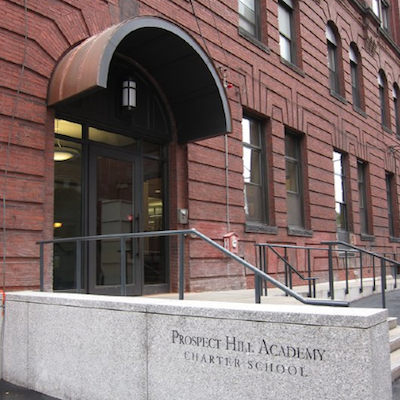
#26 Prospect Hill
Prospect Hill Academy Charter HS, Cambridge, MA
Total enrollment: 1,148
Percentage of total enrollment
Amer Indian/Alaskan: 0.3%
Asian/Pacific Islander: 6.9%
Black: 57.2%
Hispanic: 19.6%
Two or more races: 3.0%
White: 13.0%

Prev
Next
#25 Brookline HS
Brookline, MA
Total enrollment: 1,832
Percentage of total enrollment
Amer Indian/Alaskan: 0.0%
Asian/Pacific Islander: 14.8%
Black: 7.9%
Hispanic: 10.3%
Two or more races: 7.0%
White: 60.0%

Prev
Next
#24 New Bedford HS
New Bedford, MA
Total enrollment: 2,436
Percentage of total enrollment
Amer Indian/Alaskan: 0.8%
Asian/Pacific Islander: 1.7%
Black: 14.8%
Hispanic: 31.1%
Two or more races: 6.5%
White: 45.0%

Prev
Next
#23 Randolph HS
New Bedford, MA
Total enrollment: 746
Percentage of total enrollment
Amer Indian/Alaskan: 0.5%
Asian/Pacific Islander: 17.4%
Black: 58.7%
Hispanic: 9.0%
Two or more races: 1.6%
White: 12.7%

Prev
Next
#22 Charlestown HS
Charlestown, MA
Total enrollment: 935
Percentage of total enrollment
Amer Indian/Alaskan: 0.4%
Asian/Pacific Islander: 20.2%
Black: 41.9%
Hispanic: 30.4%
Two or more races: 0.9%
White: 6.2%

Prev
Next
#21 Burncoat Senior HS
Worcester, MA
Total enrollment: 996
Percentage of total enrollment
Amer Indian/Alaskan: 0.4%
Asian/Pacific Islander: 5.1%
Black: 17.1%
Hispanic: 39.8%
Two or more races: 2.1%
White: 35.5%

Prev
Next
#20 Springfield Ren.
Springfield Renaissance School, Springfield, MA
Total enrollment: 705
Percentage of total enrollment
Amer Indian/Alaskan: 0.1%
Asian/Pacific Islander: 1.4%
Black: 25.5%
Hispanic: 42.6%
Two or more races: 6.1%
White: 24.3%

Prev
Next
#19 Sabis International
Sabis Int'l Charter School, Springfield, MA
Total enrollment: 1,574
Percentage of total enrollment
Amer Indian/Alaskan: 0.0%
Asian/Pacific Islander: 2.8%
Black: 30.1%
Hispanic: 33.2%
Two or more races: 5.2%
White: 28.2%

Prev
Next
#18 Quincy Upper HS
Boston, MA
Total enrollment: 487
Percentage of total enrollment
Amer Indian/Alaskan: 0.0%
Asian/Pacific Islander: 53.2%
Black: 20.7%
Hispanic: 16.8%
Two or more races: 2.3%
White: 7.0%

Prev
Next
#17 Springfield Central HS
Springfield, MA
Total enrollment: 2,086
Percentage of total enrollment
Amer Indian/Alaskan: 0.0%
Asian/Pacific Islander: 6.6%
Black: 24.1%
Hispanic: 49.8%
Two or more races: 3.7%
White: 15.7%
Prev
Next
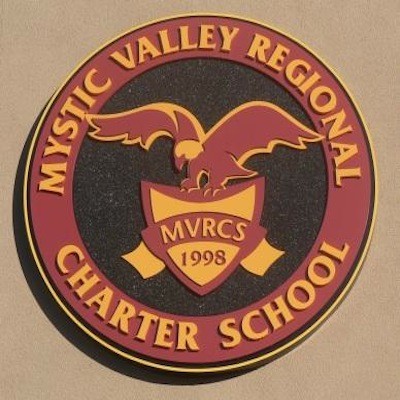
#16 Mystic Valley
Mystic Valley Reg. Charter HS, Malden, MA
Total enrollment: 1,499
Percentage of total enrollment
Amer Indian/Alaskan: 0.1%
Asian/Pacific Islander: 16.0%
Black: 16.6%
Hispanic: 6.2%
Two or more races: 3.9%
White: 57.2%

Prev
Next
#15 Univ. Park Campus
University Park Campus HS, Worcester, MA
Total enrollment: 230
Percentage of total enrollment
Amer Indian/Alaskan: 0.0%
Asian/Pacific Islander: 23.9%
Black: 7.4%
Hispanic: 49.3%
Two or more races: 2.2%
White: 18.3%

Prev
Next
#14 Doherty Mem. HS
Worcester, MA
Total enrollment: 1,337
Percentage of total enrollment
Amer Indian/Alaskan: 0.6%
Asian/Pacific Islander: 9.3%
Black: 14.1%
Hispanic: 30.3%
Two or more races: 2.2%
White: 43.4%

Prev
Next
#13 North HS
Worcester, MA
Total enrollment: 1,295
Percentage of total enrollment
Amer Indian/Alaskan: 0.2%
Asian/Pacific Islander: 8.3%
Black: 19.2%
Hispanic: 46.4%
Two or more races: 1.7%
White: 24.2%

Prev
Next
#12 Lowell HS
Lowell, MA
Total enrollment: 3,054
Percentage of total enrollment
Amer Indian/Alaskan: 0.1%
Asian/Pacific Islander: 32.5%
Black: 9.7%
Hispanic: 24.1%
Two or more races: 1.1%
White: 32.4%

Prev
Next
#11 Whaling City Alt.
Whaling City Alternative HS, New Bedford, MA
Total enrollment: 99
Percentage of total enrollment
Amer Indian/Alaskan: 2.0%
Asian/Pacific Islander: 1.0%
Black: 20.2%
Hispanic: 37.4%
Two or more races: 8.1%
White: 31.4%

Prev
Next
#10 Somerville HS
Somerville, MA
Total enrollment: 1,265
Percentage of total enrollment
Amer Indian/Alaskan: 0.2%
Asian/Pacific Islander: 11.6%
Black: 15.3%
Hispanic: 39.8%
Two or more races: 0.9%
White: 32.3%

Prev
Next
#9 Pioneer Charter
Pioneer Charter School of Science, Everett, MA
Total enrollment: 359
Percentage of total enrollment
Amer Indian/Alaskan: 2.5%
Asian/Pacific Islander: 8.7%
Black: 37.0%
Hispanic: 17.8%
Two or more races: 0.6%
White: 33.4%

Prev
Next
#8 Lynn Classical HS
Lynn, MA
Total enrollment: 1,498
Percentage of total enrollment
Amer Indian/Alaskan: 0.1%
Asian/Pacific Islander: 11.8%
Black: 14.3%
Hispanic: 45.6%
Two or more races: 2.7%
White: 25.4%

Prev
Next
#7 Cambridge Rindge
Cambridge Rindge and Latin, Cambridge, MA
Total enrollment: 1,741
Percentage of total enrollment
Amer Indian/Alaskan: 0.6%
Asian/Pacific Islander: 11.8%
Black: 33.2%
Hispanic: 14.0%
Two or more races: 3.0%
White: 37.5%

Prev
Next
#6 Fecteau-Leary
Fecteau-Leary Junior/Senior HS, Lynn, MA
Total enrollment: 157
Percentage of total enrollment
Amer Indian/Alaskan: 0.6%
Asian/Pacific Islander: 8.3%
Black: 19.7%
Hispanic: 43.3%
Two or more races: 3.8%
White: 24.2%

Prev
Next
#5 O'Bryant HS
Roxbury, MA
Total enrollment: 1,353
Percentage of total enrollment
Amer Indian/Alaskan: 0.1%
Asian/Pacific Islander: 21.3%
Black: 37.2%
Hispanic: 28.6%
Two or more races: 1.6%
White: 11.1%

Prev
Next
#4 Excel HS
South Boston, MA
Total enrollment: 550
Percentage of total enrollment
Amer Indian/Alaskan: 0.5%
Asian/Pacific Islander: 22.5%
Black: 38.4%
Hispanic: 23.3%
Two or more races: 1.6%
White: 13.6%

Prev
Next
#3 South HS
Worcester, MA
Total enrollment: 1,264
Percentage of total enrollment
Amer Indian/Alaskan: 0.6%
Asian/Pacific Islander: 14.9%
Black: 19.6%
Hispanic: 39.2%
Two or more races: 1.7%
White: 24.1%

Prev
Next
#2 Boston Latin Acad.
Dorchester, MA
Total enrollment: 1,689
Percentage of total enrollment
Amer Indian/Alaskan: 0.7%
Asian/Pacific Islander: 21.6%
Black: 27.1%
Hispanic: 20.7%
Two or more races: 1.8%
White: 28.2%

Prev
Next
#1 Malden HS
Malden, MA
Total enrollment: 1,835
Percentage of total enrollment
Amer Indian/Alaskan: 0.7%
Asian/Pacific Islander: 24.9%
Black: 22.6%
Hispanic: 19.9%
Two or more races: 3.7%
White: 28.3%
Related Articles
Enjoy this post? Share it with others.
Email to a friend
Permalink


Follow us on Pinterest Google + Facebook Twitter See It Read It