Massachusetts Tops New England in Personal Income Growth


Friday, April 25, 2014

The BEA reported that real personal income, which is based on actual personal income but is adjusted for inflation from year to year and cost of living from state to state, rose 2.7 percent in the Commonwealth, which was higher than all other New England states, as well as the national average, which was 2.3%
SLIDES: See How Metropolitan Areas in New England Ranked for Income Growth BELOW
"For the first time, Americans looking to move or take a job anywhere in the country can compare inflation-adjusted incomes across states and metropolitan areas to better understand how their personal income may be affected by a job change or move," said U.S. Secretary of Commerce Penny Pritzker in a statement with the report's release.
"Businesses considering relocating or establishing new plants also now have a comprehensive and consistent measure of differences in the cost of living and the purchasing power of consumers nationwide. The Commerce Department’s 'Open for Business Agenda' prioritizes making our data more accessible and understandable so that it can continue powering both small and large businesses nationwide."
Reading the Data

"Real personal income is an important statistic, and the fact that MA grew at a faster rate than other New England states or the national economy is encouraging to those of us living here," said White. "Unfortunately, this data is only available with a substantial lag (2 years) so currently personal incomes might be growing at a substantially different rate."
In February, White released a Worcester Economic Index predicting modest growth for Worcester for the first half of 2014, predicting an overall grown for the city of 1.5%. White's next report is expected in May.
Regarding the BEA data, White said, "An interesting part of the release is the new Regional Price Parities (RPPs) which allow for differences in prices across states to be taken into account when calculating real personal income. With a value of 107.2, Massachusetts was about 7% more expensive than the U.S. average, making it the 7th most expensive state to live in."
White continued, "This is useful because it allows for real personal income to be calculated taking state price differences into account. For example, in 2012 MA had the 2nd highest personal income per capita (behind Conn.), but when taking regional price differences into account MA has the 4th highest real personal income per capita. States like Wyoming and North Dakota which have below average prices actually jump over MA when real personal income is measured in this way. "
Regional perspectives
The rest of New England trailed Massachusetts as follows.
From 2011 to 2012, Rhode Island's personal income rose 1.6 percent; Connecticut, 1.4 percent; New Hampshire, 1.1 percent; Vermont, 1.0 percent; and Maine, 0.3 percent.
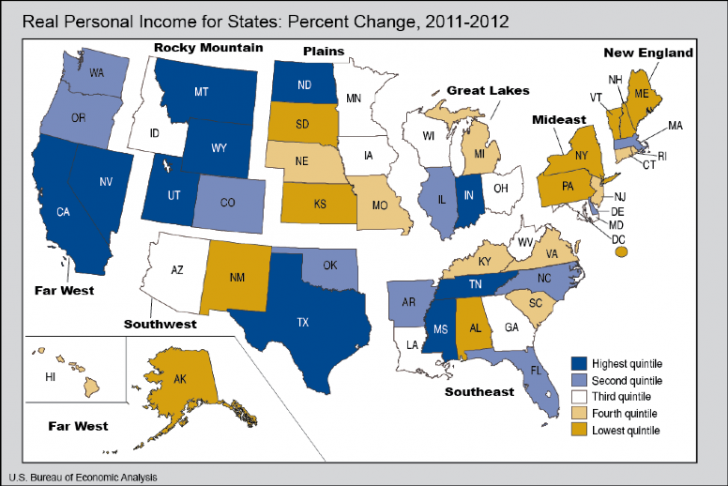
Overall, Maine has the slowest growth of 49 states, as South Dakota was the only state to see a decline in real personal income, with a drop of 1.2 percent.
Neighboring North Dakota topped the ranking with a reported real income growth of 15.1 percent from 2011 to 2012.
Related Slideshow: Bureau of Economic Analysis: Real Personal Income Data for New England Municipalities, 2008-2012
The U.S. Department of Commerce released "real personal income" data for both all the states, as well as metropolitan area, from 2008 to 2012.
Below are the New England metro areas ranked from least personal income growth from 2011 to 2012 -- to the most, as well as prior years.
Related Articles
- Bill Delahunt: A New England Patent Office Will Boost the Economy
- Will a Minimum Wage Hike Hurt or Help Worcester’s Economy?
- Report: Slow Growth in MA Economy Cause for Concern
- Could $100 Million Rail Deal Jump Start Worcester’s Economy?
- Worcester Activists Reinventing Local Economy
- Grace Ross: Stop Repeating History; Fix the Economy!
- Fed Issues Report on New England Economy - Beige Book
- Worcester Economy Stuck In Neutral
- Grace Ross: Time To Retrofit Our Economy
- Global Economy Focus of Bryant Financial Forum
- NEW: Scott Brown Calls for Bipartisan Effort to Restore Economy
- Has the Worcester Economy Become Too Dependent on Meds + Eds?
- Grace Ross: Postal Service Cuts—It’s Not the Bad Economy
- NEW: RI Congressional Delegation—No ‘Silver Bullets’ for Economy
- Julia Steiny: Economy To Youth: Make Your Own Jobs
- Romeo Brothers Revitalize Downtown Millbury Economy
- NEW: RI Economy Still Expanding
- Lack Of Hotels Costing Worcester Economy
- $3 Million Grant Passed for Worcester Economy, Tourism
- Where is the Rhode Island Economy Going?
- Raimondo: Pensions Dragging Down RI Economy
- MA Business Confidence Shows Economy on the Rebound
- Bale, Cooper, Lawrence Movie Bolstering Worcester Economy
- Will Warren’s Bank Committee Appointment Slow the Economy?
- Report: MA Beer Distributors Pump Nearly $900 Million into State Economy


 Delivered Free Every
Follow us on Pinterest Google + Facebook Twitter See It Read It