Nativity Worcester President Appointed Chair of NativityMiguel Coalition


 Email to a friend
Permalink
Email to a friend
Permalink
Thursday, October 09, 2014
GoLocalWorcester News Team
Alex Zequeira, the President of Nativity School of Worcester – the city’s only private, tuition-free middle school for boys from low-income backgrounds – has been appointed as the Chairperson of the Members Advisory Council for the newly formed national NativityMiguel Coalition.
The NativityMiguel Coalition consists of 35 schools across the nation that have reinvented the former NativityMiguel Network of Schools so that they may thrive while educating America’s urban, poor.
“I am honored to serve in this capacity for the new NativityMiguel Coalition,” said Zequeira. “I am thrilled to play a part in the development of NativityMiguel model schools that have already done, and continue to do, so much for an underserved population that is falling behind in classrooms across the country. Our schools equip our students with the tools and opportunities to break the cycle of poverty through education. The NativityMiguel Coalition will allow us to further improve and replicate a model of education that is working in our most distressed neighborhoods across the country.”
For more than 40 years, Nativity-model schools have made a unique impact in communities nationwide by providing a quality, faith-based education for students from low-income families. In the spring of 2012, the NativityMiguel Network, an organization founded to support the needs of schools, suddenly dissolved, leaving the schools without a meaningful, formal association with other mission-aligned schools and like-minded leaders. Barely skipping a beat, the schools themselves picked up the cause and re-formed the organization with a new name, NativityMiguel Coalition, and a new structure driven by the member schools.
“We maintain the same mission and hold each other accountable to the same standards that lead to strong educational outcomes,” says Terry Shields, the Coalition’s new Director and the organization’s former Vice President for Mission and Programming. “These independent, faith-based schools face similar challenges and thrive on the ideas, expertise and best-practice-sharing that comes with being part of a larger group.”
There are currently 35 member schools founding the Coalition, and they are educating over 2,700 students and supporting 5,100 graduates. Based on 2012-13 data, 87% of students at member schools are eligible for free or reduced lunch, 45% are African-American and 36% are Hispanic. The schools are located in 15 states, the District of Columbia, and one Canadian province. Nativity School of Worcester, one of the founding member schools, is educating 63 middle school students and supporting 113 graduates.
According to Zequeira and Shields, the Coalition will maintain three primary objectives:
• Ensure that member schools are delivering a mission-aligned, faith-based education with excellent outcomes.
• Compel, equip and inspire member schools with the expertise to support immediate and long-term growth.
• Promote practices within the Coalition to inform and spur excellence in other faith-based schools.
The Coalition’s first conference is being held October 27 and 28 in Philadelphia in partnership with St. Joseph’s University.
Related Slideshow: Central MA High Schools—2014 Rankings
Add link to methodology post.
Prev
Next
#59 Tantasqua Regional Vocational
Fiskdale, MA
2014 Overall MA Rank: #328
Enrollment (2010–2011): 460
Testing
Proficient or Higher ENGLISH LANGUAGE ARTS (ELA) 2011: 93%
Proficient or Higher MATH 2011: 72%
Proficient or Higher SCIENCE 2011: 54%
Average Total SAT Score: 1453
2014 performance at a glance
Student to Teacher Ratio (2010–2011): 38.1
4-Year Graduation Rates (2010): 89.3%
Spending per Student (2009–2010, by District): $12,985

Prev
Next
#58 North High
Worcester, MA
2014 Overall MA Rank: #321
Enrollment (2010–2011): 1295
Testing
Proficient or Higher ENGLISH LANGUAGE ARTS (ELA) 2011: 71%
Proficient or Higher MATH 2011: 48%
Proficient or Higher SCIENCE 2011: 34%
Average Total SAT Score: 1272
2014 performance at a glance
Student to Teacher Ratio (2010–2011): 17.9
4-Year Graduation Rates (2010): 65.2%
Spending per Student (2009–2010, by District): $13,489

Prev
Next
#57 Southbridge High
Southbridge, MA
2014 Overall MA Rank: #315
Enrollment (2010–2011): 472
Testing
Proficient or Higher ENGLISH LANGUAGE ARTS (ELA) 2011: 73%
Proficient or Higher MATH 2011: 46%
Proficient or Higher SCIENCE 2011: 45%
Average Total SAT Score: 1179
2014 performance at a glance
Student to Teacher Ratio (2010–2011): 13.8
4-Year Graduation Rates (2010): 84.4%
Spending per Student (2009–2010, by District): $12,894

Prev
Next
#56 Claremont Academy
Worcester, MA
2014 Overall MA Rank: #309
Enrollment (2010–2011): 267
Testing
Proficient or Higher ENGLISH LANGUAGE ARTS (ELA) 2011: 73%
Proficient or Higher MATH 2011: 45%
Proficient or Higher SCIENCE 2011: 27%
Average Total SAT Score: 1258
2014 performance at a glance
Student to Teacher Ratio (2010–2011): 12
4-Year Graduation Rates (2010): 72.5%
Spending per Student (2009–2010, by District): $13,489

Prev
Next
#55 South High Community
Worcester, MA
2014 Overall MA Rank: #306
Enrollment (2010–2011): 1264
Testing
Proficient or Higher ENGLISH LANGUAGE ARTS (ELA) 2011: 78%
Proficient or Higher MATH 2011: 56%
Proficient or Higher SCIENCE 2011: 44%
Average Total SAT Score: 1309
2014 performance at a glance
Student to Teacher Ratio (2010–2011): 15.2
4-Year Graduation Rates (2010): 64.7%
Spending per Student (2009–2010, by District): $13,489

Prev
Next
#54 Fitchburg High
Fitchburg, MA
2014 Overall MA Rank: #299
Enrollment (2010–2011): 1116
Testing
Proficient or Higher ENGLISH LANGUAGE ARTS (ELA) 2011: 83%
Proficient or Higher MATH 2011: 66%
Proficient or Higher SCIENCE 2011: 46%
Average Total SAT Score: 1294
2014 performance at a glance
Student to Teacher Ratio (2010–2011): 14.5
4-Year Graduation Rates (2010): 82.8%
Spending per Student (2009–2010, by District): $12,681

Prev
Next
#53 Burncoat Senior High
Worcester, MA
2014 Overall MA Rank: #295
Enrollment (2010–2011): 996
Testing
Proficient or Higher ENGLISH LANGUAGE ARTS (ELA) 2011: 78%
Proficient or Higher MATH 2011: 61%
Proficient or Higher SCIENCE 2011: 38%
Average Total SAT Score: 1340
2014 performance at a glance
Student to Teacher Ratio (2010–2011): 12.6
4-Year Graduation Rates (2010): 72.2%
Spending per Student (2009–2010, by District): $13,489

Prev
Next
#52 Ware Junior/Senior High School
Ware, MA
2014 Overall MA Rank: #277
Enrollment (2010–2011): 280
Testing
Proficient or Higher ENGLISH LANGUAGE ARTS (ELA) 2011: 86%
Proficient or Higher MATH 2011: 71%
Proficient or Higher SCIENCE 2011: 63%
Average Total SAT Score: 1429
2014 performance at a glance
Student to Teacher Ratio (2010–2011): 13.2
4-Year Graduation Rates (2010): 76.5%
Spending per Student (2009–2010, by District): $11,919

Prev
Next
#51 Doherty Memorial High
Worcester, MA
2014 Overall MA Rank: #275
Enrollment (2010–2011): 1337
Testing
Proficient or Higher ENGLISH LANGUAGE ARTS (ELA) 2011: 86%
Proficient or Higher MATH 2011: 71%
Proficient or Higher SCIENCE 2011: 62%
Average Total SAT Score: 1417
2014 performance at a glance
Student to Teacher Ratio (2010–2011): 14.8
4-Year Graduation Rates (2010): 83.2%
Spending per Student (2009–2010, by District): $13,489

Prev
Next
#50 Worcester Technical High
Worcester, MA
2014 Overall MA Rank: #271
Enrollment (2010–2011): 1358
Testing
Proficient or Higher ENGLISH LANGUAGE ARTS (ELA) 2011: 92%
Proficient or Higher MATH 2011: 84%
Proficient or Higher SCIENCE 2011: 59%
Average Total SAT Score: 1249
2014 performance at a glance
Student to Teacher Ratio (2010–2011): 11.8
4-Year Graduation Rates (2010): 95%
Spending per Student (2009–2010, by District): $13,489

Prev
Next
#49 Bartlett Jr Sr High School
Webster, MA
2014 Overall MA Rank: #270
Enrollment (2010–2011): 472
Testing
Proficient or Higher ENGLISH LANGUAGE ARTS (ELA) 2011: 93%
Proficient or Higher MATH 2011: 81%
Proficient or Higher SCIENCE 2011: 55%
Average Total SAT Score: 1387
2014 performance at a glance
Student to Teacher Ratio (2010–2011): 12.5
4-Year Graduation Rates (2010): 70%
Spending per Student (2009–2010, by District): $12,786

Prev
Next
#48 Murdock Middle/High
Winchendon, MA
2014 Overall MA Rank: #265
Enrollment (2010–2011): 325
Testing
Proficient or Higher ENGLISH LANGUAGE ARTS (ELA) 2011: 80%
Proficient or Higher MATH 2011: 60%
Proficient or Higher SCIENCE 2011: 52%
Average Total SAT Score: 1483
2014 performance at a glance
Student to Teacher Ratio (2010–2011): 11.7
4-Year Graduation Rates (2010): 91%
Spending per Student (2009–2010, by District): $12,737

Prev
Next
#47 David Prouty High
Spencer, MA
2014 Overall MA Rank: #262
Enrollment (2010–2011): 473
Testing
Proficient or Higher ENGLISH LANGUAGE ARTS (ELA) 2011: 90%
Proficient or Higher MATH 2011: 82%
Proficient or Higher SCIENCE 2011: 54%
Average Total SAT Score: 1468
2014 performance at a glance
Student to Teacher Ratio (2010–2011): 14.5
4-Year Graduation Rates (2010): 87.7%
Spending per Student (2009–2010, by District): $12,290

Prev
Next
#46 Athol-Royalston High
Athol, MA
2014 Overall MA Rank: #254
Enrollment (2010–2011): 378
Testing
Proficient or Higher ENGLISH LANGUAGE ARTS (ELA) 2011: 90%
Proficient or Higher MATH 2011: 72%
Proficient or Higher SCIENCE 2011: 76%
Average Total SAT Score: 1364
2014 performance at a glance
Student to Teacher Ratio (2010–2011): 11.9
4-Year Graduation Rates (2010): 81.9%
Spending per Student (2009–2010, by District): $13,679
Prev
Next
#45 Leominster Senior High
Leominster, MA
2014 Overall MA Rank: #253
Enrollment (2010–2011): 1105
Testing
Proficient or Higher ENGLISH LANGUAGE ARTS (ELA) 2011: 91%
Proficient or Higher MATH 2011: 74%
Proficient or Higher SCIENCE 2011: 82%
Average Total SAT Score: 1472
2014 performance at a glance
Student to Teacher Ratio (2010–2011): 15.6
4-Year Graduation Rates (2010): 90.4%
Spending per Student (2009–2010, by District): $12,233

Prev
Next
#44 University Pk Campus School
Worcester, MA
2014 Overall MA Rank: #249
Enrollment (2010–2011): 148
Testing
Proficient or Higher ENGLISH LANGUAGE ARTS (ELA) 2011: 94%
Proficient or Higher MATH 2011: 74%
Proficient or Higher SCIENCE 2011: 62%
Average Total SAT Score: 1384
2014 performance at a glance
Student to Teacher Ratio (2010–2011): 13.3
4-Year Graduation Rates (2010): 100%
Spending per Student (2009–2010, by District): $13,489

Prev
Next
#43 Clinton Senior High
Clinton, MA
2014 Overall MA Rank: #246
Enrollment (2010–2011): 466
Testing
Proficient or Higher ENGLISH LANGUAGE ARTS (ELA) 2011: 95%
Proficient or Higher MATH 2011: 79%
Proficient or Higher SCIENCE 2011: 65%
Average Total SAT Score: 1473
2014 performance at a glance
Student to Teacher Ratio (2010–2011): 13.6
4-Year Graduation Rates (2010): 89.1%
Spending per Student (2009–2010, by District): $11,273

Prev
Next
#42 Oxford High
Oxford, MA
2014 Overall MA Rank: #241
Enrollment (2010–2011): 450
Testing
Proficient or Higher ENGLISH LANGUAGE ARTS (ELA) 2011: 84%
Proficient or Higher MATH 2011: 69%
Proficient or Higher SCIENCE 2011: 67%
Average Total SAT Score: 1504
2014 performance at a glance
Student to Teacher Ratio (2010–2011): 11.5
4-Year Graduation Rates (2010): 80.6%
Spending per Student (2009–2010, by District): $11,955

Prev
Next
#41 Uxbridge High
Uxbridge, MA
2014 Overall MA Rank: #234
Enrollment (2010–2011): 478
Testing
Proficient or Higher ENGLISH LANGUAGE ARTS (ELA) 2011: 87%
Proficient or Higher MATH 2011: 76%
Proficient or Higher SCIENCE 2011: 77%
Average Total SAT Score: 1548
2014 performance at a glance
Student to Teacher Ratio (2010–2011): 15.8
4-Year Graduation Rates (2010): 89.2%
Spending per Student (2009–2010, by District): $12,074

Prev
Next
#40 Northbridge High
Whitinsville, MA
2014 Overall MA Rank: #222
Enrollment (2010–2011): 677
Testing
Proficient or Higher ENGLISH LANGUAGE ARTS (ELA) 2011: 92%
Proficient or Higher MATH 2011: 74%
Proficient or Higher SCIENCE 2011: 75%
Average Total SAT Score: 1525
2014 performance at a glance
Student to Teacher Ratio (2010–2011): 12.6
4-Year Graduation Rates (2010): 84.2%
Spending per Student (2009–2010, by District): $11,129

Prev
Next
#39 Douglas High School
Douglas, MA
2014 Overall MA Rank: #220
Enrollment (2010–2011): 573
Testing
Proficient or Higher ENGLISH LANGUAGE ARTS (ELA) 2011: 93%
Proficient or Higher MATH 2011: 81%
Proficient or Higher SCIENCE 2011: 78%
Average Total SAT Score: 1538
2014 performance at a glance
Student to Teacher Ratio (2010–2011): 13.1
4-Year Graduation Rates (2010): 85.1%
Spending per Student (2009–2010, by District): $10,070

Prev
Next
#38 Shepherd Hill Regional High
Dudley, MA
2014 Overall MA Rank: #219
Enrollment (2010–2011): 1106
Testing
Proficient or Higher ENGLISH LANGUAGE ARTS (ELA) 2011: 93%
Proficient or Higher MATH 2011: 86%
Proficient or Higher SCIENCE 2011: 84%
Average Total SAT Score: 1523
2014 performance at a glance
Student to Teacher Ratio (2010–2011): 15.1
4-Year Graduation Rates (2010): 93.9%
Spending per Student (2009–2010, by District): $10,624

Prev
Next
#37 Milford High
Milford, MA
2014 Overall MA Rank: #216
Enrollment (2010–2011): 1111
Testing
Proficient or Higher ENGLISH LANGUAGE ARTS (ELA) 2011: 92%
Proficient or Higher MATH 2011: 80%
Proficient or Higher SCIENCE 2011: 72%
Average Total SAT Score: 1512
2014 performance at a glance
Student to Teacher Ratio (2010–2011): 13.6
4-Year Graduation Rates (2010): 87.5%
Spending per Student (2009–2010, by District): $12,284

Prev
Next
#36 Abby Kelley Foster Charter
Worcester, MA
2014 Overall MA Rank: #214
Enrollment (2010–2011): 343
Testing
Proficient or Higher ENGLISH LANGUAGE ARTS (ELA) 2011: 100%
Proficient or Higher MATH 2011: 88%
Proficient or Higher SCIENCE 2011: 70%
Average Total SAT Score: 1386
2014 performance at a glance
Student to Teacher Ratio (2010–2011): 12.8
4-Year Graduation Rates (2010): 92%
Spending per Student (2009–2010, by District): $13,489

Prev
Next
#35 Gardner High
Gardner, MA
2014 Overall MA Rank: #201
Enrollment (2010–2011): 563
Testing
Proficient or Higher ENGLISH LANGUAGE ARTS (ELA) 2011: 94%
Proficient or Higher MATH 2011: 80%
Proficient or Higher SCIENCE 2011: 70%
Average Total SAT Score: 1534
2014 performance at a glance
Student to Teacher Ratio (2010–2011): 12.4
4-Year Graduation Rates (2010): 87.4%
Spending per Student (2009–2010, by District): $11,310

Prev
Next
#34 Narragansett Regional High
Baldwinville, MA
2014 Overall MA Rank: #199
Enrollment (2010–2011): 385
Testing
Proficient or Higher ENGLISH LANGUAGE ARTS (ELA) 2011: 97%
Proficient or Higher MATH 2011: 82%
Proficient or Higher SCIENCE 2011: 82%
Average Total SAT Score: 1438
2014 performance at a glance
Student to Teacher Ratio (2010–2011): 11.7
4-Year Graduation Rates (2010): 92.6%
Spending per Student (2009–2010, by District): $11,738

Prev
Next
#33 North Brookfield High
North Brookfield, MA
2014 Overall MA Rank: #198
Enrollment (2010–2011): 223
Testing
Proficient or Higher ENGLISH LANGUAGE ARTS (ELA) 2011: 97%
Proficient or Higher MATH 2011: 77%
Proficient or Higher SCIENCE 2011: 71%
Average Total SAT Score: 1448
2014 performance at a glance
Student to Teacher Ratio (2010–2011): 10.1
4-Year Graduation Rates (2010): 84.6%
Spending per Student (2009–2010, by District): $12,295

Prev
Next
#32 North Central Charter Essential
Fitchburg, MA
2014 Overall MA Rank: #197
Enrollment (2010–2011): 219
Testing
Proficient or Higher ENGLISH LANGUAGE ARTS (ELA) 2011: 95%
Proficient or Higher MATH 2011: 89%
Proficient or Higher SCIENCE 2011: 54%
Average Total SAT Score: 1429
2014 performance at a glance
Student to Teacher Ratio (2010–2011): 9.4
4-Year Graduation Rates (2010): 86.3%
Spending per Student (2009–2010, by District): $12,681

Prev
Next
#31 Montachusett Regional Vocational
Fitchburg, MA
2014 Overall MA Rank: #193
Enrollment (2010–2011): 1433
Testing
Proficient or Higher ENGLISH LANGUAGE ARTS (ELA) 2011: 95%
Proficient or Higher MATH 2011: 80%
Proficient or Higher SCIENCE 2011: 72%
Average Total SAT Score: 1387
2014 performance at a glance
Student to Teacher Ratio (2010–2011): 13.9
4-Year Graduation Rates (2010): 96.6%
Spending per Student (2009–2010, by District): $17,281

Prev
Next
#30 Assabet Valley Vocational High
Marlborough, MA
2014 Overall MA Rank: #183
Enrollment (2010–2011): 1026
Testing
Proficient or Higher ENGLISH LANGUAGE ARTS (ELA) 2011: 93%
Proficient or Higher MATH 2011: 77%
Proficient or Higher SCIENCE 2011: 76%
Average Total SAT Score: 1322
2014 performance at a glance
Student to Teacher Ratio (2010–2011): 10.6
4-Year Graduation Rates (2010): 90.8%
Spending per Student (2009–2010, by District): $17,360

Prev
Next
#29 North Middlesex Regional
Townsend, MA
2014 Overall MA Rank: #182
Enrollment (2010–2011): 956
Testing
Proficient or Higher ENGLISH LANGUAGE ARTS (ELA) 2011: 97%
Proficient or Higher MATH 2011: 87%
Proficient or Higher SCIENCE 2011: 79%
Average Total SAT Score: 1545
2014 performance at a glance
Student to Teacher Ratio (2010–2011): 14.4
4-Year Graduation Rates (2010): 93.7%
Spending per Student (2009–2010, by District): $11,461

Prev
Next
#28 West Boylston Jr Sr High
West Boylston, MA
2014 Overall MA Rank: #178
Enrollment (2010–2011): 278
Testing
Proficient or Higher ENGLISH LANGUAGE ARTS (ELA) 2011: 94%
Proficient or Higher MATH 2011: 83%
Proficient or Higher SCIENCE 2011: 81%
Average Total SAT Score: 1470
2014 performance at a glance
Student to Teacher Ratio (2010–2011): 11.4
4-Year Graduation Rates (2010): 89.1%
Spending per Student (2009–2010, by District): $12,384

Prev
Next
#27 Quaboag Regional High
Warren, MA
2014 Overall MA Rank: #177
Enrollment (2010–2011): 364
Testing
Proficient or Higher ENGLISH LANGUAGE ARTS (ELA) 2011: 92%
Proficient or Higher MATH 2011: 86%
Proficient or Higher SCIENCE 2011: 81%
Average Total SAT Score: 1521
2014 performance at a glance
Student to Teacher Ratio (2010–2011): 11.8
4-Year Graduation Rates (2010): 79.4%
Spending per Student (2009–2010, by District): $12,077

Prev
Next
#26 Southwich-Tolland Regional High
Southwick, MA
2014 Overall MA Rank: #172
Enrollment (2010–2011): 544
Testing
Proficient or Higher ENGLISH LANGUAGE ARTS (ELA) 2011: 94%
Proficient or Higher MATH 2011: 81%
Proficient or Higher SCIENCE 2011: 75%
Average Total SAT Score: 1552
2014 performance at a glance
Student to Teacher Ratio (2010–2011): 12
4-Year Graduation Rates (2010): 88.1%
Spending per Student (2009–2010, by District): $11,547

Prev
Next
#25 Grafton High School
Grafton, MA
2014 Overall MA Rank: #168
Enrollment (2010–2011): 767
Testing
Proficient or Higher ENGLISH LANGUAGE ARTS (ELA) 2011: 93%
Proficient or Higher MATH 2011: 89%
Proficient or Higher SCIENCE 2011: 87%
Average Total SAT Score: 1578
2014 performance at a glance
Student to Teacher Ratio (2010–2011): 13.7
4-Year Graduation Rates (2010): 93.4%
Spending per Student (2009–2010, by District): $10,064

Prev
Next
#24 Sutton High School
Sutton, MA
2014 Overall MA Rank: #164
Enrollment (2010–2011): 418
Testing
Proficient or Higher ENGLISH LANGUAGE ARTS (ELA) 2011: 94%
Proficient or Higher MATH 2011: 91%
Proficient or Higher SCIENCE 2011: 75%
Average Total SAT Score: 1596
2014 performance at a glance
Student to Teacher Ratio (2010–2011): 14.6
4-Year Graduation Rates (2010): 94.1%
Spending per Student (2009–2010, by District): $11,329

Prev
Next
#23 Marlborough High
Marlborough, MA
2014 Overall MA Rank: #162
Enrollment (2010–2011): 1075
Testing
Proficient or Higher ENGLISH LANGUAGE ARTS (ELA) 2011: 89%
Proficient or Higher MATH 2011: 79%
Proficient or Higher SCIENCE 2011: 67%
Average Total SAT Score: 1515
2014 performance at a glance
Student to Teacher Ratio (2010–2011): 10.7
4-Year Graduation Rates (2010): 84.1%
Spending per Student (2009–2010, by District): $14,198

Prev
Next
#22 Hopedale Jr. Sr. High
Hopedale, MA
2014 Overall MA Rank: #161
Enrollment (2010–2011): 344
Testing
Proficient or Higher ENGLISH LANGUAGE ARTS (ELA) 2011: 100%
Proficient or Higher MATH 2011: 94%
Proficient or Higher SCIENCE 2011: 84%
Average Total SAT Score: 1519
2014 performance at a glance
Student to Teacher Ratio (2010–2011): 13.4
4-Year Graduation Rates (2010): 96.6%
Spending per Student (2009–2010, by District): $10,448

Prev
Next
#21 Bay Path Regional Vocation Technical
Charlton, MA
2014 Overall MA Rank: #156
Enrollment (2010–2011): 1104
Testing
Proficient or Higher ENGLISH LANGUAGE ARTS (ELA) 2011: 93%
Proficient or Higher MATH 2011: 82%
Proficient or Higher SCIENCE 2011: 75%
Average Total SAT Score: 1346
2014 performance at a glance
Student to Teacher Ratio (2010–2011): 9.9
4-Year Graduation Rates (2010): 90.5%
Spending per Student (2009–2010, by District): $16,966

Prev
Next
#20 Hudson High
Hudson, MA
2014 Overall MA Rank: #154
Enrollment (2010–2011): 1113
Testing
Proficient or Higher ENGLISH LANGUAGE ARTS (ELA) 2011: 98%
Proficient or Higher MATH 2011: 91%
Proficient or Higher SCIENCE 2011: 73%
Average Total SAT Score: 1475
2014 performance at a glance
Student to Teacher Ratio (2010–2011): 12
4-Year Graduation Rates (2010): 90.2%
Spending per Student (2009–2010, by District): $13,294

Prev
Next
#19 Wachusset Regional High
Holden, MA
2014 Overall MA Rank: #152
Enrollment (2010–2011): 2095
Testing
Proficient or Higher ENGLISH LANGUAGE ARTS (ELA) 2011: 96%
Proficient or Higher MATH 2011: 91%
Proficient or Higher SCIENCE 2011: 83%
Average Total SAT Score: 1617
2014 performance at a glance
Student to Teacher Ratio (2010–2011): 15.1
4-Year Graduation Rates (2010): 93%
Spending per Student (2009–2010, by District): $10,817

Prev
Next
#18 Millbury Junior/Senior High
Millbury, MA
2014 Overall MA Rank: #150
Enrollment (2010–2011): 713
Testing
Proficient or Higher ENGLISH LANGUAGE ARTS (ELA) 2011: 95%
Proficient or Higher MATH 2011: 80%
Proficient or Higher SCIENCE 2011: 68%
Average Total SAT Score: 1517
2014 performance at a glance
Student to Teacher Ratio (2010–2011): 11.2
4-Year Graduation Rates (2010): 89.7%
Spending per Student (2009–2010, by District): $13,444

Prev
Next
#17 Oakmont Regional High School
Ashburnham, MA
2014 Overall MA Rank: #148
Enrollment (2010–2011): 689
Testing
Proficient or Higher ENGLISH LANGUAGE ARTS (ELA) 2011: 99%
Proficient or Higher MATH 2011: 89%
Proficient or Higher SCIENCE 2011: 86%
Average Total SAT Score: 1567
2014 performance at a glance
Student to Teacher Ratio (2010–2011): 15.3
4-Year Graduation Rates (2010): 95.1%
Spending per Student (2009–2010, by District): $12,027

Prev
Next
#16 Ayer Shirley Regional High School
Ayer, MA
2014 Overall MA Rank: #146
Enrollment (2010–2011): 325
Testing
Proficient or Higher ENGLISH LANGUAGE ARTS (ELA) 2011: 95%
Proficient or Higher MATH 2011: 88%
Proficient or Higher SCIENCE 2011: 85%
Average Total SAT Score: 1447
2014 performance at a glance
Student to Teacher Ratio (2010–2011): 10.3
4-Year Graduation Rates (2010): 83.8%
Spending per Student (2009–2010, by District): $13,040

Prev
Next
#15 Auburn Senior High
Auburn, MA
2014 Overall MA Rank: #144
Enrollment (2010–2011): 689
Testing
Proficient or Higher ENGLISH LANGUAGE ARTS (ELA) 2011: 95%
Proficient or Higher MATH 2011: 89%
Proficient or Higher SCIENCE 2011: 84%
Average Total SAT Score: 1489
2014 performance at a glance
Student to Teacher Ratio (2010–2011): 11.8
4-Year Graduation Rates (2010): 94.7%
Spending per Student (2009–2010, by District): $12,211

Prev
Next
#14 Nipmuc Regional High
Upton, MA
2014 Overall MA Rank: #134
Enrollment (2010–2011): 667
Testing
Proficient or Higher ENGLISH LANGUAGE ARTS (ELA) 2011: 95%
Proficient or Higher MATH 2011: 94%
Proficient or Higher SCIENCE 2011: 90%
Average Total SAT Score: 1557
2014 performance at a glance
Student to Teacher Ratio (2010–2011): 13.8
4-Year Graduation Rates (2010): 96.8%
Spending per Student (2009–2010, by District): $11,242

Prev
Next
#13 Shrewsbury Sr. High
Shrewsbury, MA
2014 Overall MA Rank: #117
Enrollment (2010–2011): 1647
Testing
Proficient or Higher ENGLISH LANGUAGE ARTS (ELA) 2011: 98%
Proficient or Higher MATH 2011: 94%
Proficient or Higher SCIENCE 2011: 90%
Average Total SAT Score: 1677
2014 performance at a glance
Student to Teacher Ratio (2010–2011): 16.9
4-Year Graduation Rates (2010): 94.7%
Spending per Student (2009–2010, by District): $11,318

Prev
Next
#12 Lunenburg High
Lunenburg, MA
2014 Overall MA Rank: #104
Enrollment (2010–2011): 577
Testing
Proficient or Higher ENGLISH LANGUAGE ARTS (ELA) 2011: 97%
Proficient or Higher MATH 2011: 96%
Proficient or Higher SCIENCE 2011: 97%
Average Total SAT Score: 1546
2014 performance at a glance
Student to Teacher Ratio (2010–2011): 13
4-Year Graduation Rates (2010): 96.8%
Spending per Student (2009–2010, by District): $11,448

Prev
Next
#11 Blackstone Valley Reg. Vocational
Upton, MA
2014 Overall MA Rank: #85
Enrollment (2010–2011): 1164
Testing
Proficient or Higher ENGLISH LANGUAGE ARTS (ELA) 2011: 99%
Proficient or Higher MATH 2011: 95%
Proficient or Higher SCIENCE 2011: 91%
Average Total SAT Score: 1434
2014 performance at a glance
Student to Teacher Ratio (2010–2011): 13.2
4-Year Graduation Rates (2010): 97.8%
Spending per Student (2009–2010, by District): $17,131

Prev
Next
#10 Tahanto Regional High
Boylston), MA
2014 Overall MA Rank: #80
Enrollment (2010–2011): 282
Testing
Proficient or Higher ENGLISH LANGUAGE ARTS (ELA) 2011: 95%
Proficient or Higher MATH 2011: 89%
Proficient or Higher SCIENCE 2011: 94%
Average Total SAT Score: 1613
2014 performance at a glance
Student to Teacher Ratio (2010–2011): 12.7
4-Year Graduation Rates (2010): 86.9%
Spending per Student (2009–2010, by District): $13,409

Prev
Next
#9 Nashoba Regional
Bolton, MA
2014 Overall MA Rank: #76
Enrollment (2010–2011): 1033
Testing
Proficient or Higher ENGLISH LANGUAGE ARTS (ELA) 2011: 95%
Proficient or Higher MATH 2011: 92%
Proficient or Higher SCIENCE 2011: 87%
Average Total SAT Score: 1680
2014 performance at a glance
Student to Teacher Ratio (2010–2011): 14.6
4-Year Graduation Rates (2010): 95.1%
Spending per Student (2009–2010, by District): $12,686
Prev
Next
#8 Leominster High School & Ctr for Tech
Leominster, MA
2014 Overall MA Rank: #64
Enrollment (2010–2011): 34
Testing
Proficient or Higher ENGLISH LANGUAGE ARTS (ELA) 2011: 85%
Proficient or Higher MATH 2011: 82%
Proficient or Higher SCIENCE 2011: 75%
Average Total SAT Score: 1416
2014 performance at a glance
Student to Teacher Ratio (2010–2011):
4-Year Graduation Rates (2010): 92.6%
Spending per Student (2009–2010, by District): $12,233
Prev
Next
#7 Tantasqua Regional Sr. High
Fiskdale, MA
2014 Overall MA Rank: #63
Enrollment (2010–2011): 756
Testing
Proficient or Higher ENGLISH LANGUAGE ARTS (ELA) 2011: 97%
Proficient or Higher MATH 2011: 86%
Proficient or Higher SCIENCE 2011: 75%
Average Total SAT Score: 1607
2014 performance at a glance
Student to Teacher Ratio (2010–2011): 9.7
4-Year Graduation Rates (2010): 94.9%
Spending per Student (2009–2010, by District): $12,985

Prev
Next
#6 Groton Dunstable Regional
Groton, MA
2014 Overall MA Rank: #62
Enrollment (2010–2011): 870
Testing
Proficient or Higher ENGLISH LANGUAGE ARTS (ELA) 2011: 99%
Proficient or Higher MATH 2011: 98%
Proficient or Higher SCIENCE 2011: 95%
Average Total SAT Score: 1664
2014 performance at a glance
Student to Teacher Ratio (2010–2011): 14.6
4-Year Graduation Rates (2010): 97%
Spending per Student (2009–2010, by District): $12,261

Prev
Next
#5 Hopkinton High
Hopkinton, MA
2014 Overall MA Rank: #53
Enrollment (2010–2011): 1150
Testing
Proficient or Higher ENGLISH LANGUAGE ARTS (ELA) 2011: 98%
Proficient or Higher MATH 2011: 95%
Proficient or Higher SCIENCE 2011: 93%
Average Total SAT Score: 1688
2014 performance at a glance
Student to Teacher Ratio (2010–2011): 14.5
4-Year Graduation Rates (2010): 99.2%
Spending per Student (2009–2010, by District): $12,472

Prev
Next
#4 Algonquin Regional High
Northborough, MA
2014 Overall MA Rank: #33
Enrollment (2010–2011): 1471
Testing
Proficient or Higher ENGLISH LANGUAGE ARTS (ELA) 2011: 99%
Proficient or Higher MATH 2011: 95%
Proficient or Higher SCIENCE 2011: 96%
Average Total SAT Score: 1715
2014 performance at a glance
Student to Teacher Ratio (2010–2011): 14.3
4-Year Graduation Rates (2010): 97.5%
Spending per Student (2009–2010, by District): $13,900
Prev
Next
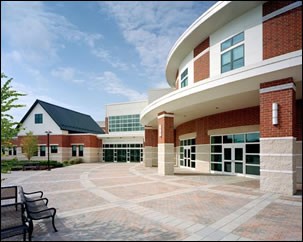
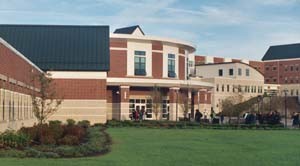
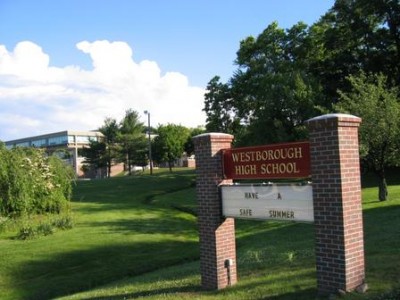
#3 Westborough High
Westborough, MA
2014 Overall MA Rank: #26
Enrollment (2010–2011): 1053
Testing
Proficient or Higher ENGLISH LANGUAGE ARTS (ELA) 2011: 97%
Proficient or Higher MATH 2011: 93%
Proficient or Higher SCIENCE 2011: 95%
Average Total SAT Score: 1716
2014 performance at a glance
Student to Teacher Ratio (2010–2011): 12.6
4-Year Graduation Rates (2010): 96.6%
Spending per Student (2009–2010, by District): $14,545
Prev
Next
#2 Bromfield
Harvard, MA
2014 Overall MA Rank: #13
Enrollment (2010–2011): 709
Testing
Proficient or Higher ENGLISH LANGUAGE ARTS (ELA) 2011: 100%
Proficient or Higher MATH 2011: 97%
Proficient or Higher SCIENCE 2011: 97%
Average Total SAT Score: 1824
2014 performance at a glance
Student to Teacher Ratio (2010–2011): 13.8
4-Year Graduation Rates (2010): 98.3%
Spending per Student (2009–2010, by District): $13,984

Prev
Next
#1 Advanced Math and Science Academy
Marlborough, MA
2014 Overall MA Rank: #6
Enrollment (2010–2011): 567
Testing
Proficient or Higher ENGLISH LANGUAGE ARTS (ELA) 2011: 100%
Proficient or Higher MATH 2011: 100%
Proficient or Higher SCIENCE 2011: 98%
Average Total SAT Score: 1825
2014 performance at a glance
Student to Teacher Ratio (2010–2011): 11.5
4-Year Graduation Rates (2010): 98.6%
Spending per Student (2009–2010, by District): $14,198
Related Articles
Enjoy this post? Share it with others.
Email to a friend
Permalink


 Delivered Free Every
Follow us on Pinterest Google + Facebook Twitter See It Read It