Superintendent Reveals More Information on Proposed Academy


 Email to a friend
Permalink
Email to a friend
Permalink
Friday, December 19, 2014
Patrick Sargent, GoLocal Worcester Contributor
On Thursday evening, Worcester Public School Superintendent Dr. Melinda Boone revealed more details on the proposed Academy for Advanced Learners at Doherty Memorial High School. As
reported by GoLocal, Dr.Boone initially presented this idea to the Worcester School Committee earlier this month.
One question about the Academy was presented to Dr.Boone by School Committee member Tracy O'Connell-Novick. O'Connell-Novick asked how the decision to choose Doherty as the Academy location was made. "In terms of how the location was selected, why are we having it at Doherty? I ask the question because of the demographics of the district. It seems like the school that's least likely, in terms of a choice for a program of this nature, to put it at a school, to be blunt, that is the most middle-class and most white. It seems kind of an interesting choice," said O'Connell-Novick.
Dr.Boone said, "This is a district-wide program. It’s not limited to any one school and Doherty is the most centrally located high school. For ease of transportation and access, that was the purpose. If we are making this available to all our students, how do we facilitate access to the program transportation wise."
As proposed, the Academy for Advanced Learners will be an International Baccalaureate (IB) program for grades nine through 12. Students will be required to complete six international baccalaureate courses and will have to take special examinations in grades 11 and 12.
School Committee member Brian O'Connell suggested the city takes its time with the academy and to not 'get so far down the road' before the administration gets ahead of itself. O'Connell expressed his concern that the Doherty community may not be able to handle an academy at that location.
”Doherty has a number of concerns, not so much in terms of the program, but in terms of school capacity to absorb the program. The school has larger classes, it’s limited in terms of space, and we all know Doherty struggles with limitations in technology.”
Admission Criteria a Concern for School Committee Members
The IB program is recognized by higher education. The academy will be a highly competitive school with a maximum attendance of 250 for students in grades 9-12. The target initial year is the 2016-2017 school year and enrollment would being with an entering 9th grade class and possibly 10th grade class.
The admission criteria is an application, grades from previous year and current year, standardized test scores, transcripts, a student essay, a recommendation from one core academic teacher, and attendance and discipline histories.The application process will be coordinated by members from the district and applicants will receive an overall scored based on an admission rubric. Scores will be weighted and granted for completion of certain pre-requisites. A lottery will be held if applications exceed attendance limit.
“The other concern that I have is to make sure that we haven't yet finalized our plans in terms of not only what we are going in the siting of the school, but in terms of the criteria of admission to the school," said O'Connell. "The criteria presented by the administration clearly avoid the prospect of having a test. A test that is designed specifically for admission to the program. And I suggest that it is the exact opposite direction from the one we should be taking.”
“All students are gifted, but not all students are gifted with the academic capabilities or the synapses to be able to handle aggressive academic work and significant volumes at a very high level. And whether our program really adheres to those standards becomes subjective.”
“Testing alone is not a perfect indicator of someone’s success. We are seeing that with SAT testing. There are far more skill sets beyond just taking a single test to measure whether you can be successful at something as rigorous as the IB program," said Committee Member John Foley.
The committee and administration will hold a public hearing within the next few months. According to Mayor Joe Petty, "The Superintendent is going to go out and do a site visit to address space issues and logistics. By August, we will have an advisory committee. Once the school committee votes on it in April, we will have the advisory committee set up in August and then we will have one year of planning."
Related Slideshow: The 50 Most Diverse High Schools in Massachusetts

Prev
Next
#50 Curtis-Tufts HS
Medford, MA
Total enrollment: 67
Percentage of total enrollment
Amer Indian/Alaskan: 0.0%
Asian/Pacific Islander: 4.5%
Black: 27.3%
Hispanic: 13.6%
Two or more races: 0.0%
White: 54.5%

Prev
Next
#49 Boston Green Acad.
Boston Green Acad. Horace Mann Charter, Boston, MA
Total enrollment: 324
Percentage of total enrollment
Amer Indian/Alaskan: 0.3%
Asian/Pacific Islander: 2.8%
Black: 53.1%
Hispanic: 28.4%
Two or more races: 0.3%
White: 15.1%

Prev
Next
#48 Fitchburg HS
Fitchburg, MA
Total enrollment: 1,116
Percentage of total enrollment
Amer Indian/Alaskan: 0.1%
Asian/Pacific Islander: 7.0%
Black: 7.3%
Hispanic: 44.8%
Two or more races: 4.1%
White: 36.6%

Prev
Next
#47 Global Learning
Global Learning Charter Public HS, New Bedford, MA
Total enrollment: 501
Percentage of total enrollment
Amer Indian/Alaskan: 0.8%
Asian/Pacific Islander: 1.0%
Black: 12.6%
Hispanic: 27.9%
Two or more races: 4.2%
White: 53.5%

Prev
Next
#46 Lowell Middlesex
Lowell Middlesex Acad. Charter HS, Lowell, MA
Total enrollment: 99
Percentage of total enrollment
Amer Indian/Alaskan: 0.0%
Asian/Pacific Islander: 11.1%
Black: 2.0%
Hispanic: 38.4%
Two or more races: 5.1%
White: 42.4%

Prev
Next
#45 Community Academy
Jamaica Plain, MA
Total enrollment: 67
Percentage of total enrollment
Amer Indian/Alaskan: 0.0%
Asian/Pacific Islander: 0.0%
Black: 40.3%
Hispanic: 16.4%
Two or more races: 3.0%
White: 40.3%

Prev
Next
#44 Quincy HS
Quincy, MA
Total enrollment: 1,519
Percentage of total enrollment
Amer Indian/Alaskan: 0.7%
Asian/Pacific Islander: 23.9%
Black: 9.8%
Hispanic: 7.4%
Two or more races: 1.8%
White: 56.3%

Prev
Next
#43 Foxborough Regional
Foxborough Reg. Charter HS, Foxborough, MA
Total enrollment: 1,265
Percentage of total enrollment
Amer Indian/Alaskan: 0.0%
Asian/Pacific Islander: 10.4%
Black: 23.8%
Hispanic: 5.1%
Two or more races: 4.5%
White: 56.3%

Prev
Next
#42 Boston Collegiate
Boston Collegiate Charter HS, Dorchester, MA
Total enrollment: 632
Percentage of total enrollment
Amer Indian/Alaskan: 0.3%
Asian/Pacific Islander: 1.9%
Black: 25.5%
Hispanic: 15.7%
Two or more races: 2.2%
White: 54.4%

Prev
Next
#41 Full Circle HS
Somerville, MA
Total enrollment: 56
Percentage of total enrollment
Amer Indian/Alaskan: 0.0%
Asian/Pacific Islander: 1.8%
Black: 21.4%
Hispanic: 35.7%
Two or more races: 1.8%
White: 39.3%

Prev
Next
#40 Waltham Senior HS
Waltham, MA
Total enrollment: 1,389
Percentage of total enrollment
Amer Indian/Alaskan: 0.1%
Asian/Pacific Islander: 6.4%
Black: 11.2%
Hispanic: 30.6%
Two or more races: 2.6%
White: 49.1%

Prev
Next
#39 Medford HS
Medford MA
Total enrollment: 1,155
Percentage of total enrollment
Amer Indian/Alaskan: 0.3%
Asian/Pacific Islander: 10.0%
Black: 18.4%
Hispanic: 8.2%
Two or more races: 1.9%
White: 61.9%

Prev
Next
#38 Snowden International
Snowden Int'l School at Copley, Boston, MA
Total enrollment: 397
Percentage of total enrollment
Amer Indian/Alaskan: 0.3%
Asian/Pacific Islander: 7.6%
Black: 38.3%
Hispanic: 41.3%
Two or more races: 3.0%
White: 9.6%

Prev
Next
#37 Brockton HS
Brockton Champion HS, Brockton, MA
Total enrollment: 194
Percentage of total enrollment
Amer Indian/Alaskan: 0.5%
Asian/Pacific Islander: 1.0%
Black: 41.2%
Hispanic: 19.6%
Two or more races: 2.6%
White: 35.1%

Prev
Next
#36 Worcester Tech. HS
Worcester, MA
Total enrollment: 1,358
Percentage of total enrollment
Amer Indian/Alaskan: 0.5%
Asian/Pacific Islander: 5.8%
Black: 12.4%
Hispanic: 34.6%
Two or more races: 2.2%
White: 44.5%

Prev
Next
#35 Acad. of the Pac. Rim
Acad. of the Pac. Rim Charter Public HS, Hyde Park MA
Total enrollment: 498
Percentage of total enrollment
Amer Indian/Alaskan: 0.0%
Asian/Pacific Islander: 1.4%
Black: 58.4%
Hispanic: 20.5%
Two or more races: 3.4%
White: 16.3%

Prev
Next
#34 Lynn Vocational
Lynn Vocational Tech. Institute, Lynn, MA
Total enrollment: 750
Percentage of total enrollment
Amer Indian/Alaskan: 0.8%
Asian/Pacific Islander: 6.7%
Black: 10.7%
Hispanic: 60.0%
Two or more races: 2.9%
White: 18.9%

Prev
Next
#33 Boston Arts Academy
Boston, MA
Total enrollment: 445
Percentage of total enrollment
Amer Indian/Alaskan: 0.4%
Asian/Pacific Islander: 3.1%
Black: 38.7%
Hispanic: 40.0%
Two or more races: 2.2%
White: 15.5%

Prev
Next
#32 Greater Lowell
Greater Lowell Reg. Vocational Tech., Tyngsborough, MA
Total enrollment: 2,112
Percentage of total enrollment
Amer Indian/Alaskan: 0.5%
Asian/Pacific Islander: 14.8%
Black: 3.9%
Hispanic: 26.6%
Two or more races: 2.6%
White: 51.7%
Prev
Next
#31 Amherst Regional HS
Amherst, MA
Total enrollment: 1,004
Percentage of total enrollment
Amer Indian/Alaskan: 0.1%
Asian/Pacific Islander: 10.0%
Black: 8.3%
Hispanic: 12.2%
Two or more races: 8.4%
White: 61.2%

Prev
Next
#30 Horace Mann
Horace Mann School for the Deaf, Allston, MA
Total enrollment: 111
Percentage of total enrollment
Amer Indian/Alaskan: 0.0%
Asian/Pacific Islander: 9.0%
Black: 36.0%
Hispanic: 41.4%
Two or more races: 1.8%
White: 11.7%

Prev
Next
#29 Everett HS
Everett, MA
Total enrollment: 2,004
Percentage of total enrollment
Amer Indian/Alaskan: 0.3%
Asian/Pacific Islander: 4.9%
Black: 23.9%
Hispanic: 32.4%
Two or more races: 1.0%
White: 37.5%

Prev
Next
#28 Lynn English HS
Lynn, MA
Total enrollment: 1,611
Percentage of total enrollment
Amer Indian/Alaskan: 0.1%
Asian/Pacific Islander: 9.9%
Black: 10.8%
Hispanic: 53.0%
Two or more races: 2.2%
White: 24.0%
Prev
Next
#27 Boston Latin HS
Boston, MA
Total enrollment: 2,379
Percentage of total enrollment
Amer Indian/Alaskan: 0.0%
Asian/Pacific Islander: 29.1%
Black: 9.5%
Hispanic: 10.6%
Two or more races: 3.1%
White: 47.7%
Prev
Next
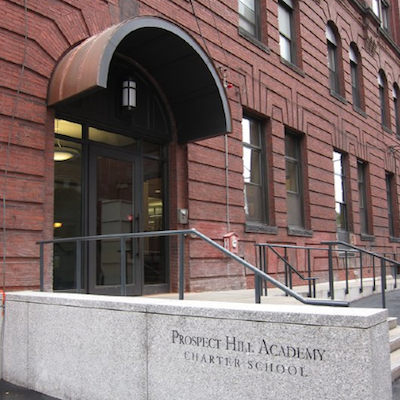
#26 Prospect Hill
Prospect Hill Academy Charter HS, Cambridge, MA
Total enrollment: 1,148
Percentage of total enrollment
Amer Indian/Alaskan: 0.3%
Asian/Pacific Islander: 6.9%
Black: 57.2%
Hispanic: 19.6%
Two or more races: 3.0%
White: 13.0%

Prev
Next
#25 Brookline HS
Brookline, MA
Total enrollment: 1,832
Percentage of total enrollment
Amer Indian/Alaskan: 0.0%
Asian/Pacific Islander: 14.8%
Black: 7.9%
Hispanic: 10.3%
Two or more races: 7.0%
White: 60.0%

Prev
Next
#24 New Bedford HS
New Bedford, MA
Total enrollment: 2,436
Percentage of total enrollment
Amer Indian/Alaskan: 0.8%
Asian/Pacific Islander: 1.7%
Black: 14.8%
Hispanic: 31.1%
Two or more races: 6.5%
White: 45.0%

Prev
Next
#23 Randolph HS
New Bedford, MA
Total enrollment: 746
Percentage of total enrollment
Amer Indian/Alaskan: 0.5%
Asian/Pacific Islander: 17.4%
Black: 58.7%
Hispanic: 9.0%
Two or more races: 1.6%
White: 12.7%

Prev
Next
#22 Charlestown HS
Charlestown, MA
Total enrollment: 935
Percentage of total enrollment
Amer Indian/Alaskan: 0.4%
Asian/Pacific Islander: 20.2%
Black: 41.9%
Hispanic: 30.4%
Two or more races: 0.9%
White: 6.2%

Prev
Next
#21 Burncoat Senior HS
Worcester, MA
Total enrollment: 996
Percentage of total enrollment
Amer Indian/Alaskan: 0.4%
Asian/Pacific Islander: 5.1%
Black: 17.1%
Hispanic: 39.8%
Two or more races: 2.1%
White: 35.5%

Prev
Next
#20 Springfield Ren.
Springfield Renaissance School, Springfield, MA
Total enrollment: 705
Percentage of total enrollment
Amer Indian/Alaskan: 0.1%
Asian/Pacific Islander: 1.4%
Black: 25.5%
Hispanic: 42.6%
Two or more races: 6.1%
White: 24.3%

Prev
Next
#19 Sabis International
Sabis Int'l Charter School, Springfield, MA
Total enrollment: 1,574
Percentage of total enrollment
Amer Indian/Alaskan: 0.0%
Asian/Pacific Islander: 2.8%
Black: 30.1%
Hispanic: 33.2%
Two or more races: 5.2%
White: 28.2%

Prev
Next
#18 Quincy Upper HS
Boston, MA
Total enrollment: 487
Percentage of total enrollment
Amer Indian/Alaskan: 0.0%
Asian/Pacific Islander: 53.2%
Black: 20.7%
Hispanic: 16.8%
Two or more races: 2.3%
White: 7.0%

Prev
Next
#17 Springfield Central HS
Springfield, MA
Total enrollment: 2,086
Percentage of total enrollment
Amer Indian/Alaskan: 0.0%
Asian/Pacific Islander: 6.6%
Black: 24.1%
Hispanic: 49.8%
Two or more races: 3.7%
White: 15.7%
Prev
Next
#16 Mystic Valley
Mystic Valley Reg. Charter HS, Malden, MA
Total enrollment: 1,499
Percentage of total enrollment
Amer Indian/Alaskan: 0.1%
Asian/Pacific Islander: 16.0%
Black: 16.6%
Hispanic: 6.2%
Two or more races: 3.9%
White: 57.2%

Prev
Next
#15 Univ. Park Campus
University Park Campus HS, Worcester, MA
Total enrollment: 230
Percentage of total enrollment
Amer Indian/Alaskan: 0.0%
Asian/Pacific Islander: 23.9%
Black: 7.4%
Hispanic: 49.3%
Two or more races: 2.2%
White: 18.3%

Prev
Next
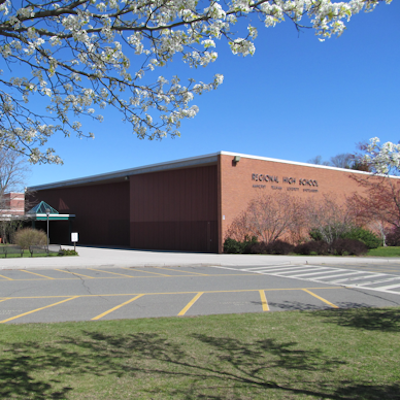
#14 Doherty Mem. HS
Worcester, MA
Total enrollment: 1,337
Percentage of total enrollment
Amer Indian/Alaskan: 0.6%
Asian/Pacific Islander: 9.3%
Black: 14.1%
Hispanic: 30.3%
Two or more races: 2.2%
White: 43.4%

Prev
Next
#13 North HS
Worcester, MA
Total enrollment: 1,295
Percentage of total enrollment
Amer Indian/Alaskan: 0.2%
Asian/Pacific Islander: 8.3%
Black: 19.2%
Hispanic: 46.4%
Two or more races: 1.7%
White: 24.2%

Prev
Next
#12 Lowell HS
Lowell, MA
Total enrollment: 3,054
Percentage of total enrollment
Amer Indian/Alaskan: 0.1%
Asian/Pacific Islander: 32.5%
Black: 9.7%
Hispanic: 24.1%
Two or more races: 1.1%
White: 32.4%

Prev
Next
#11 Whaling City Alt.
Whaling City Alternative HS, New Bedford, MA
Total enrollment: 99
Percentage of total enrollment
Amer Indian/Alaskan: 2.0%
Asian/Pacific Islander: 1.0%
Black: 20.2%
Hispanic: 37.4%
Two or more races: 8.1%
White: 31.4%

Prev
Next
#10 Somerville HS
Somerville, MA
Total enrollment: 1,265
Percentage of total enrollment
Amer Indian/Alaskan: 0.2%
Asian/Pacific Islander: 11.6%
Black: 15.3%
Hispanic: 39.8%
Two or more races: 0.9%
White: 32.3%

Prev
Next
#9 Pioneer Charter
Pioneer Charter School of Science, Everett, MA
Total enrollment: 359
Percentage of total enrollment
Amer Indian/Alaskan: 2.5%
Asian/Pacific Islander: 8.7%
Black: 37.0%
Hispanic: 17.8%
Two or more races: 0.6%
White: 33.4%

Prev
Next
#8 Lynn Classical HS
Lynn, MA
Total enrollment: 1,498
Percentage of total enrollment
Amer Indian/Alaskan: 0.1%
Asian/Pacific Islander: 11.8%
Black: 14.3%
Hispanic: 45.6%
Two or more races: 2.7%
White: 25.4%

Prev
Next
#7 Cambridge Rindge
Cambridge Rindge and Latin, Cambridge, MA
Total enrollment: 1,741
Percentage of total enrollment
Amer Indian/Alaskan: 0.6%
Asian/Pacific Islander: 11.8%
Black: 33.2%
Hispanic: 14.0%
Two or more races: 3.0%
White: 37.5%

Prev
Next
#6 Fecteau-Leary
Fecteau-Leary Junior/Senior HS, Lynn, MA
Total enrollment: 157
Percentage of total enrollment
Amer Indian/Alaskan: 0.6%
Asian/Pacific Islander: 8.3%
Black: 19.7%
Hispanic: 43.3%
Two or more races: 3.8%
White: 24.2%

Prev
Next
#5 O'Bryant HS
Roxbury, MA
Total enrollment: 1,353
Percentage of total enrollment
Amer Indian/Alaskan: 0.1%
Asian/Pacific Islander: 21.3%
Black: 37.2%
Hispanic: 28.6%
Two or more races: 1.6%
White: 11.1%

Prev
Next
#4 Excel HS
South Boston, MA
Total enrollment: 550
Percentage of total enrollment
Amer Indian/Alaskan: 0.5%
Asian/Pacific Islander: 22.5%
Black: 38.4%
Hispanic: 23.3%
Two or more races: 1.6%
White: 13.6%

Prev
Next
#3 South HS
Worcester, MA
Total enrollment: 1,264
Percentage of total enrollment
Amer Indian/Alaskan: 0.6%
Asian/Pacific Islander: 14.9%
Black: 19.6%
Hispanic: 39.2%
Two or more races: 1.7%
White: 24.1%

Prev
Next
#2 Boston Latin Acad.
Dorchester, MA
Total enrollment: 1,689
Percentage of total enrollment
Amer Indian/Alaskan: 0.7%
Asian/Pacific Islander: 21.6%
Black: 27.1%
Hispanic: 20.7%
Two or more races: 1.8%
White: 28.2%

Prev
Next
#1 Malden HS
Malden, MA
Total enrollment: 1,835
Percentage of total enrollment
Amer Indian/Alaskan: 0.7%
Asian/Pacific Islander: 24.9%
Black: 22.6%
Hispanic: 19.9%
Two or more races: 3.7%
White: 28.3%
Related Articles
Enjoy this post? Share it with others.
Email to a friend
Permalink


 Delivered Free Every
Follow us on Pinterest Google + Facebook Twitter See It Read It