Will Dr.Boone’s New Academy Strip City’s High Schools of Best Students?


 Email to a friend
Permalink
Email to a friend
Permalink
Monday, December 08, 2014
Patrick Sargent, GoLocal Worcester Contributor
On Thursday evening, during a Worcester School Committee meeting, Worcester Public Schools Superintendent Dr. Melinda Boone revealed her plans for a special academy at Doherty Memorial High School. The proposed academy will hold a maximum of 250 of the best and brightest students from the area.
“I want to be clear, and I will make sure that the public and the school community understand this fully. This pilot innovation academy is not designed to replace, supplant or undermine any of the existing programs serving gifted or high achieving students,” said Boone. “Rather, the pilot innovation academy will be an additional option within our portfolio of school choices within the Worcester Public Schools.”
Plucking the Top Students From Worcester
During a slideshow presented by Dr.Boone at the meeting, one slide read: 'The academy will attract students from throughout Worcester.'
"Dr.Boone is looking at it pragmatically. Realistically though, if there’s some students that have the capabilities, a parent isn’t going to not look at the program. They're not going to say I won’t put my child in a program that’s going to have the extra rigor that the International Baccalaureate program has. It’s certainly an issue I will bring up Dr. Boone at our next meeting," said John Monfredo, former principal and current Worcester School Committee member.
In 2012, Mayor Joe Petty developed a community task force, chaired by School Committee member Tracy O'Connell Novick, to address the need for an exam school for gifted learners. As Dr.Boone pointed out in her slideshow, although Massachusetts leads the pack in education in the country, the state still falls shy of it's progress in educating gifted students. "This is very important for Worcester Public Schools. I know Dr.Boone is very sensitive and the Committee is sensitive as to how it affects the other high schools in the city," said Petty.
Worcester School Committee member Brian O'Connell said, "The recommendation is to have an International Baccalaureate (IB) Program. It's a program that is going to have a lot of draw to it, but it's not a program that is going to draw all gifted students, by any means. Its a rigorous program."
The IB program requires it's students to complete six international baccalaureate courses in grades nine through 12. In grades 11 and 12, the students take special examinations and assessments in those particular subjects. They are graded by external examiners. The subjects the students take are Languages, Social Studies, Science, Mathematics, and the Arts. They require the students to do independent research on a subject of study and write an extended essay on that subject.
Will the Academy Affect Other High School Classrooms?
O'Connell said, "The idea of having a program of this nature will be a boost to the school system if the program is designed right, and has built within it a sufficient academic rigor to provide a significant challenge to our academically gifted students."
According to Department of Education's 2014 data, and as GoLocal Worcester previously reported, the Worcester Public School District has an Accountability and Assistance Level of 4. This is specifically due to two elementary schools being considered level 4. The district is classified at the level of its lowest performing school. 22 of Worcester’s public schools are Level 3 (14 elementary schools, and 8 middle and high schools).
Worcester has the highest percentage of English Language Learner (ELL) students in the state (31.7%). Last school year, nearly 30% of students in Worcester had more than nine unexcused absences. 73% of Worcester’s students come from low-income families and 20% of it’s students have some form of disability. Across the district, the average student to teacher ratio is 17.4:1.
"Some of those gifted students that have the capabilities in the classroom are certainly the ones helping students that are having difficulties," said Monfredo.
O'Connell said, "Nobody looking at this program, if we do establish it, is going to mistake it for a Boston Latin school by any means. Parents of students who do look at it closely will certainly have opinions about it, whether its what they're looking for as an academic focus. It will certainly attract those students, it may not attract others. It's another opportunity the students will have."
Monfredo said, “We have an outstanding program at the Goddard Scholars Academy at Sullivan Middle. I suggested that we could replicate that program because we get kids coming from as far as the Burncoat area and they have to come across the city. I would like to see this program at Burncoat Middle School. I think it would make more sense to consider something like that in the future as well. I simply don’t want to see what we are doing at the Goddard Scholars Program or at South High School take a hit because of this new program. They’ve been very successful. The Goddard Scholars Program is on a waiting list. Could we replicate that at another middle school?"
O'Connell doesn't think programs like Goddard Scholars will lose students to the proposed academy. "If parents are looking closely at both programs, they will see an advantage to both programs, but they might find the Goddard program more in their range of activity and interest."
Admission Criteria Being Questioned
"I am concerned that with the program being proposed, the administration is recommending a number of admission criteria which does not include an examination for students. I really had hoped the recommendation would include an examination specifically to the academic program to determine if the students would have the scope and range and capability and terms of knowledge that would address that particular curriculum," said O'Connell.
As proposed, the admission criteria is an application, grades from previous year and current year, standardized test scores, transcripts, a student essay, a recommendation from one core academic teacher, and attendance and discipline histories.
The application process will be coordinated by members from the district and applicants will receive an overall scored based on an admission rubric. Scores will be weighted and granted for completion of certain pre-requisites. A lottery will be held if applications exceed attendance limit.
"An entrance examination could address if the students are prepared," said O'Connell. "Its unfortunate that was not part of what the administration recommended. I think it leaves the admission criteria very subjective and perhaps not as focused on providing a clear lining of demarcation in terms of whether students have the capability of handling more intensive IB work itself. It has the potential to undermine the program in certain key respects in terms of the students who will be accepted into the program. Had it been included in the criteria, I think it would have been a useful means of selecting students for the program and be able to draw the line and deal with any pressure to admit people they know, including friends, relatives and individuals in the school system looking to get their children into the program. I don't sense the school administration wants an examination of any kind."
The Cost of an International Baccalaureate Program
Monfredo said, "In the research that I have done, the IB program in it's first year is estimated to be over $400,000. This is a program administered from outside the district. Lots of questions need to be answered on long term financial resources, and what impact will this have on the rest of school system. I wish we could look at early education the same way we are looking at the accelerated school in terms of committing resources."
According to the presentation, the academy's budget will more than $6.25 million over the course of its first year of planning and the following four years in existence.
Monfredo said, “I would certainly support additional funding on programs that are going to be beneficial to our children. We need to expand our early childhood program. It’s important for our children to have the necessary readiness skills to move forward. In Worcester, we don't’t have every kindergarten with a teacher assistant in the classroom. I think that’s an area that we really need to take a look at.”
The average instructional assistant salary is nearly $40,000. With the $6 million in start up costs for this academy, 31 more classrooms in the city could have an instructional assistant every year for the next five years.
School Committee Members Have More Concerns
The IB program is recognized by higher education. The academy will be a highly competitive school with a maximum attendance of 250 for students in grades 9-12. The target initial year is the 2016-2017 school year and enrollment would being with an entering 9th grade class and possibly 10th grade class.
"Another question that I will be asking is whether we have the space at Doherty High School. I'm not too sure there is enough room," said Monfredo.
O'Connell said, "In Doherty, our second biggest high school, is there even enough space for the program and can the program be established on Doherty without putting pressure on the site of the building and putting pressure on the available resources at the building? Does it run the risk of scaling back because of lack of space? We also need to find out if Doherty is particularly interested in having a program."
Monfredo said, “Do I have concerns? Yes, and I will send those concerns to Dr. Boone so that she will be able to address them at the next school committee meeting. The concept is good but there are many questions to be answered and the biggest one will be the funding of the program and how it will effect the system.”
The committee will further discuss the academy at its next meeting on December 18.
Related Slideshow: The 50 Most Diverse High Schools in Massachusetts

Prev
Next
#50 Curtis-Tufts HS
Medford, MA
Total enrollment: 67
Percentage of total enrollment
Amer Indian/Alaskan: 0.0%
Asian/Pacific Islander: 4.5%
Black: 27.3%
Hispanic: 13.6%
Two or more races: 0.0%
White: 54.5%

Prev
Next
#49 Boston Green Acad.
Boston Green Acad. Horace Mann Charter, Boston, MA
Total enrollment: 324
Percentage of total enrollment
Amer Indian/Alaskan: 0.3%
Asian/Pacific Islander: 2.8%
Black: 53.1%
Hispanic: 28.4%
Two or more races: 0.3%
White: 15.1%

Prev
Next
#48 Fitchburg HS
Fitchburg, MA
Total enrollment: 1,116
Percentage of total enrollment
Amer Indian/Alaskan: 0.1%
Asian/Pacific Islander: 7.0%
Black: 7.3%
Hispanic: 44.8%
Two or more races: 4.1%
White: 36.6%

Prev
Next
#47 Global Learning
Global Learning Charter Public HS, New Bedford, MA
Total enrollment: 501
Percentage of total enrollment
Amer Indian/Alaskan: 0.8%
Asian/Pacific Islander: 1.0%
Black: 12.6%
Hispanic: 27.9%
Two or more races: 4.2%
White: 53.5%

Prev
Next
#46 Lowell Middlesex
Lowell Middlesex Acad. Charter HS, Lowell, MA
Total enrollment: 99
Percentage of total enrollment
Amer Indian/Alaskan: 0.0%
Asian/Pacific Islander: 11.1%
Black: 2.0%
Hispanic: 38.4%
Two or more races: 5.1%
White: 42.4%

Prev
Next
#45 Community Academy
Jamaica Plain, MA
Total enrollment: 67
Percentage of total enrollment
Amer Indian/Alaskan: 0.0%
Asian/Pacific Islander: 0.0%
Black: 40.3%
Hispanic: 16.4%
Two or more races: 3.0%
White: 40.3%

Prev
Next
#44 Quincy HS
Quincy, MA
Total enrollment: 1,519
Percentage of total enrollment
Amer Indian/Alaskan: 0.7%
Asian/Pacific Islander: 23.9%
Black: 9.8%
Hispanic: 7.4%
Two or more races: 1.8%
White: 56.3%

Prev
Next
#43 Foxborough Regional
Foxborough Reg. Charter HS, Foxborough, MA
Total enrollment: 1,265
Percentage of total enrollment
Amer Indian/Alaskan: 0.0%
Asian/Pacific Islander: 10.4%
Black: 23.8%
Hispanic: 5.1%
Two or more races: 4.5%
White: 56.3%

Prev
Next
#42 Boston Collegiate
Boston Collegiate Charter HS, Dorchester, MA
Total enrollment: 632
Percentage of total enrollment
Amer Indian/Alaskan: 0.3%
Asian/Pacific Islander: 1.9%
Black: 25.5%
Hispanic: 15.7%
Two or more races: 2.2%
White: 54.4%

Prev
Next
#41 Full Circle HS
Somerville, MA
Total enrollment: 56
Percentage of total enrollment
Amer Indian/Alaskan: 0.0%
Asian/Pacific Islander: 1.8%
Black: 21.4%
Hispanic: 35.7%
Two or more races: 1.8%
White: 39.3%

Prev
Next
#40 Waltham Senior HS
Waltham, MA
Total enrollment: 1,389
Percentage of total enrollment
Amer Indian/Alaskan: 0.1%
Asian/Pacific Islander: 6.4%
Black: 11.2%
Hispanic: 30.6%
Two or more races: 2.6%
White: 49.1%

Prev
Next
#39 Medford HS
Medford MA
Total enrollment: 1,155
Percentage of total enrollment
Amer Indian/Alaskan: 0.3%
Asian/Pacific Islander: 10.0%
Black: 18.4%
Hispanic: 8.2%
Two or more races: 1.9%
White: 61.9%

Prev
Next
#38 Snowden International
Snowden Int'l School at Copley, Boston, MA
Total enrollment: 397
Percentage of total enrollment
Amer Indian/Alaskan: 0.3%
Asian/Pacific Islander: 7.6%
Black: 38.3%
Hispanic: 41.3%
Two or more races: 3.0%
White: 9.6%

Prev
Next
#37 Brockton HS
Brockton Champion HS, Brockton, MA
Total enrollment: 194
Percentage of total enrollment
Amer Indian/Alaskan: 0.5%
Asian/Pacific Islander: 1.0%
Black: 41.2%
Hispanic: 19.6%
Two or more races: 2.6%
White: 35.1%

Prev
Next
#36 Worcester Tech. HS
Worcester, MA
Total enrollment: 1,358
Percentage of total enrollment
Amer Indian/Alaskan: 0.5%
Asian/Pacific Islander: 5.8%
Black: 12.4%
Hispanic: 34.6%
Two or more races: 2.2%
White: 44.5%

Prev
Next
#35 Acad. of the Pac. Rim
Acad. of the Pac. Rim Charter Public HS, Hyde Park MA
Total enrollment: 498
Percentage of total enrollment
Amer Indian/Alaskan: 0.0%
Asian/Pacific Islander: 1.4%
Black: 58.4%
Hispanic: 20.5%
Two or more races: 3.4%
White: 16.3%

Prev
Next
#34 Lynn Vocational
Lynn Vocational Tech. Institute, Lynn, MA
Total enrollment: 750
Percentage of total enrollment
Amer Indian/Alaskan: 0.8%
Asian/Pacific Islander: 6.7%
Black: 10.7%
Hispanic: 60.0%
Two or more races: 2.9%
White: 18.9%

Prev
Next
#33 Boston Arts Academy
Boston, MA
Total enrollment: 445
Percentage of total enrollment
Amer Indian/Alaskan: 0.4%
Asian/Pacific Islander: 3.1%
Black: 38.7%
Hispanic: 40.0%
Two or more races: 2.2%
White: 15.5%

Prev
Next
#32 Greater Lowell
Greater Lowell Reg. Vocational Tech., Tyngsborough, MA
Total enrollment: 2,112
Percentage of total enrollment
Amer Indian/Alaskan: 0.5%
Asian/Pacific Islander: 14.8%
Black: 3.9%
Hispanic: 26.6%
Two or more races: 2.6%
White: 51.7%
Prev
Next
#31 Amherst Regional HS
Amherst, MA
Total enrollment: 1,004
Percentage of total enrollment
Amer Indian/Alaskan: 0.1%
Asian/Pacific Islander: 10.0%
Black: 8.3%
Hispanic: 12.2%
Two or more races: 8.4%
White: 61.2%

Prev
Next
#30 Horace Mann
Horace Mann School for the Deaf, Allston, MA
Total enrollment: 111
Percentage of total enrollment
Amer Indian/Alaskan: 0.0%
Asian/Pacific Islander: 9.0%
Black: 36.0%
Hispanic: 41.4%
Two or more races: 1.8%
White: 11.7%

Prev
Next
#29 Everett HS
Everett, MA
Total enrollment: 2,004
Percentage of total enrollment
Amer Indian/Alaskan: 0.3%
Asian/Pacific Islander: 4.9%
Black: 23.9%
Hispanic: 32.4%
Two or more races: 1.0%
White: 37.5%

Prev
Next
#28 Lynn English HS
Lynn, MA
Total enrollment: 1,611
Percentage of total enrollment
Amer Indian/Alaskan: 0.1%
Asian/Pacific Islander: 9.9%
Black: 10.8%
Hispanic: 53.0%
Two or more races: 2.2%
White: 24.0%
Prev
Next
#27 Boston Latin HS
Boston, MA
Total enrollment: 2,379
Percentage of total enrollment
Amer Indian/Alaskan: 0.0%
Asian/Pacific Islander: 29.1%
Black: 9.5%
Hispanic: 10.6%
Two or more races: 3.1%
White: 47.7%
Prev
Next
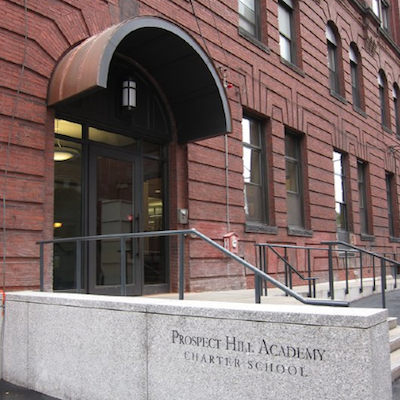
#26 Prospect Hill
Prospect Hill Academy Charter HS, Cambridge, MA
Total enrollment: 1,148
Percentage of total enrollment
Amer Indian/Alaskan: 0.3%
Asian/Pacific Islander: 6.9%
Black: 57.2%
Hispanic: 19.6%
Two or more races: 3.0%
White: 13.0%

Prev
Next
#25 Brookline HS
Brookline, MA
Total enrollment: 1,832
Percentage of total enrollment
Amer Indian/Alaskan: 0.0%
Asian/Pacific Islander: 14.8%
Black: 7.9%
Hispanic: 10.3%
Two or more races: 7.0%
White: 60.0%

Prev
Next
#24 New Bedford HS
New Bedford, MA
Total enrollment: 2,436
Percentage of total enrollment
Amer Indian/Alaskan: 0.8%
Asian/Pacific Islander: 1.7%
Black: 14.8%
Hispanic: 31.1%
Two or more races: 6.5%
White: 45.0%

Prev
Next
#23 Randolph HS
New Bedford, MA
Total enrollment: 746
Percentage of total enrollment
Amer Indian/Alaskan: 0.5%
Asian/Pacific Islander: 17.4%
Black: 58.7%
Hispanic: 9.0%
Two or more races: 1.6%
White: 12.7%

Prev
Next
#22 Charlestown HS
Charlestown, MA
Total enrollment: 935
Percentage of total enrollment
Amer Indian/Alaskan: 0.4%
Asian/Pacific Islander: 20.2%
Black: 41.9%
Hispanic: 30.4%
Two or more races: 0.9%
White: 6.2%

Prev
Next
#21 Burncoat Senior HS
Worcester, MA
Total enrollment: 996
Percentage of total enrollment
Amer Indian/Alaskan: 0.4%
Asian/Pacific Islander: 5.1%
Black: 17.1%
Hispanic: 39.8%
Two or more races: 2.1%
White: 35.5%

Prev
Next
#20 Springfield Ren.
Springfield Renaissance School, Springfield, MA
Total enrollment: 705
Percentage of total enrollment
Amer Indian/Alaskan: 0.1%
Asian/Pacific Islander: 1.4%
Black: 25.5%
Hispanic: 42.6%
Two or more races: 6.1%
White: 24.3%

Prev
Next
#19 Sabis International
Sabis Int'l Charter School, Springfield, MA
Total enrollment: 1,574
Percentage of total enrollment
Amer Indian/Alaskan: 0.0%
Asian/Pacific Islander: 2.8%
Black: 30.1%
Hispanic: 33.2%
Two or more races: 5.2%
White: 28.2%

Prev
Next
#18 Quincy Upper HS
Boston, MA
Total enrollment: 487
Percentage of total enrollment
Amer Indian/Alaskan: 0.0%
Asian/Pacific Islander: 53.2%
Black: 20.7%
Hispanic: 16.8%
Two or more races: 2.3%
White: 7.0%

Prev
Next
#17 Springfield Central HS
Springfield, MA
Total enrollment: 2,086
Percentage of total enrollment
Amer Indian/Alaskan: 0.0%
Asian/Pacific Islander: 6.6%
Black: 24.1%
Hispanic: 49.8%
Two or more races: 3.7%
White: 15.7%
Prev
Next
#16 Mystic Valley
Mystic Valley Reg. Charter HS, Malden, MA
Total enrollment: 1,499
Percentage of total enrollment
Amer Indian/Alaskan: 0.1%
Asian/Pacific Islander: 16.0%
Black: 16.6%
Hispanic: 6.2%
Two or more races: 3.9%
White: 57.2%

Prev
Next
#15 Univ. Park Campus
University Park Campus HS, Worcester, MA
Total enrollment: 230
Percentage of total enrollment
Amer Indian/Alaskan: 0.0%
Asian/Pacific Islander: 23.9%
Black: 7.4%
Hispanic: 49.3%
Two or more races: 2.2%
White: 18.3%

Prev
Next
#14 Doherty Mem. HS
Worcester, MA
Total enrollment: 1,337
Percentage of total enrollment
Amer Indian/Alaskan: 0.6%
Asian/Pacific Islander: 9.3%
Black: 14.1%
Hispanic: 30.3%
Two or more races: 2.2%
White: 43.4%

Prev
Next
#13 North HS
Worcester, MA
Total enrollment: 1,295
Percentage of total enrollment
Amer Indian/Alaskan: 0.2%
Asian/Pacific Islander: 8.3%
Black: 19.2%
Hispanic: 46.4%
Two or more races: 1.7%
White: 24.2%

Prev
Next
#12 Lowell HS
Lowell, MA
Total enrollment: 3,054
Percentage of total enrollment
Amer Indian/Alaskan: 0.1%
Asian/Pacific Islander: 32.5%
Black: 9.7%
Hispanic: 24.1%
Two or more races: 1.1%
White: 32.4%

Prev
Next
#11 Whaling City Alt.
Whaling City Alternative HS, New Bedford, MA
Total enrollment: 99
Percentage of total enrollment
Amer Indian/Alaskan: 2.0%
Asian/Pacific Islander: 1.0%
Black: 20.2%
Hispanic: 37.4%
Two or more races: 8.1%
White: 31.4%

Prev
Next
#10 Somerville HS
Somerville, MA
Total enrollment: 1,265
Percentage of total enrollment
Amer Indian/Alaskan: 0.2%
Asian/Pacific Islander: 11.6%
Black: 15.3%
Hispanic: 39.8%
Two or more races: 0.9%
White: 32.3%

Prev
Next
#9 Pioneer Charter
Pioneer Charter School of Science, Everett, MA
Total enrollment: 359
Percentage of total enrollment
Amer Indian/Alaskan: 2.5%
Asian/Pacific Islander: 8.7%
Black: 37.0%
Hispanic: 17.8%
Two or more races: 0.6%
White: 33.4%

Prev
Next
#8 Lynn Classical HS
Lynn, MA
Total enrollment: 1,498
Percentage of total enrollment
Amer Indian/Alaskan: 0.1%
Asian/Pacific Islander: 11.8%
Black: 14.3%
Hispanic: 45.6%
Two or more races: 2.7%
White: 25.4%

Prev
Next
#7 Cambridge Rindge
Cambridge Rindge and Latin, Cambridge, MA
Total enrollment: 1,741
Percentage of total enrollment
Amer Indian/Alaskan: 0.6%
Asian/Pacific Islander: 11.8%
Black: 33.2%
Hispanic: 14.0%
Two or more races: 3.0%
White: 37.5%

Prev
Next
#6 Fecteau-Leary
Fecteau-Leary Junior/Senior HS, Lynn, MA
Total enrollment: 157
Percentage of total enrollment
Amer Indian/Alaskan: 0.6%
Asian/Pacific Islander: 8.3%
Black: 19.7%
Hispanic: 43.3%
Two or more races: 3.8%
White: 24.2%

Prev
Next
#5 O'Bryant HS
Roxbury, MA
Total enrollment: 1,353
Percentage of total enrollment
Amer Indian/Alaskan: 0.1%
Asian/Pacific Islander: 21.3%
Black: 37.2%
Hispanic: 28.6%
Two or more races: 1.6%
White: 11.1%

Prev
Next
#4 Excel HS
South Boston, MA
Total enrollment: 550
Percentage of total enrollment
Amer Indian/Alaskan: 0.5%
Asian/Pacific Islander: 22.5%
Black: 38.4%
Hispanic: 23.3%
Two or more races: 1.6%
White: 13.6%

Prev
Next
#3 South HS
Worcester, MA
Total enrollment: 1,264
Percentage of total enrollment
Amer Indian/Alaskan: 0.6%
Asian/Pacific Islander: 14.9%
Black: 19.6%
Hispanic: 39.2%
Two or more races: 1.7%
White: 24.1%

Prev
Next
#2 Boston Latin Acad.
Dorchester, MA
Total enrollment: 1,689
Percentage of total enrollment
Amer Indian/Alaskan: 0.7%
Asian/Pacific Islander: 21.6%
Black: 27.1%
Hispanic: 20.7%
Two or more races: 1.8%
White: 28.2%

Prev
Next
#1 Malden HS
Malden, MA
Total enrollment: 1,835
Percentage of total enrollment
Amer Indian/Alaskan: 0.7%
Asian/Pacific Islander: 24.9%
Black: 22.6%
Hispanic: 19.9%
Two or more races: 3.7%
White: 28.3%
Related Articles
Enjoy this post? Share it with others.
Email to a friend
Permalink


Follow us on Pinterest Google + Facebook Twitter See It Read It