Welcome! Login | Register
 

Worcester Police Officer and Local Boy Drown in Accident, and in Braintree 2 Police Shot, K-9 Killed—Worcester Police Officer and Local Boy Drown in…

Person of Interest Named in Molly Bish Case By Worcester County DA—Person of Interest Named in Molly Bish Case…

Bravehearts Escape Nashua With a Win, 9th Inning Controversy—Bravehearts Escape Nashua With a Win, 9th Inning…

Worcester Regional Research Bureau Announces Recipients of 2021 Awards—Worcester Regional Research Bureau Announces Recipients of 2021…

16 Year Old Shot, Worcester Police Detectives Investigating Shooting at Crompton Park—16 Year Old Shot, Worcester Police Detectives Investigating…

Feds Charge Former MA Pizzeria Owner With PPP Fraud - Allegedly Used Loan to Purchase Alpaca Farm—Feds Charge Former MA Pizzeria Owner With PPP…

Facebook’s independent Oversight Board on Wednesday announced it has ruled in favor of upholding the—Trump's Facebook Suspension Upheld

Patriots’ Kraft Buys Hamptons Beach House for $43 Million, According to Reports—Patriots’ Kraft Buys Hamptons Beach House for $43…

Clark Alum Donates $6M to Support Arts and Music Initiatives—Clark Alum Donates $6M to Support Arts and…

CVS & Walgreens Have Wasted Nearly 130,000 Vaccine Doses, According to Report—CVS & Walgreens Have Wasted Nearly 130,000 Vaccine…


Worcester Teachers Lack Diversity Compared to Student Body

Tuesday, May 06, 2014


In a city that has become increasingly diverse over the past decade, Worcester’s public schools are not echoing the same change.

According to a report conducted by the Center for American Progress entitled “Teacher Diversity Revisited,” almost 90-percent of teachers throughout the school district are white, while only 35.8-percent of the student body meets the same demographic.

“This is the second time that we have used our teacher diversity index in a report which measures the diversity gap between students and teachers,” said Ulrich Boser, the author of the report. “We have done other reports in the past, but we haven’t used the index since 2011. This is also the first time that we have broken down some of the states at a district level.”

If using the report’s teacher diversity index, which subtracts the percentage of non-white teachers from nonwhite students, Worcester has a teacher diversity index of 53.4, which is higher than any state and is more than twenty points higher than both the state (29) and national (30) average. 

The Results

The gap represented by white students and white teachers in Worcester public schools is not the only gap of concern when looking at student/teacher diversity. 

The school districts majority group –Hispanic students – represents 38.1-percent of the student population, while only 5.2-percent of teachers are Hispanic in comparison. African Americans are also underrepresented in the district, as only 3.9-percent of teachers are employed, in contrast to a 14.2-percent African American student body.

While not the least diverse district in the state, Worcester certainly ranks toward the bottom. Although not offering any easy conclusions through the report, Boser acknowledges that local problems require local solutions. 

“I can’t say what the solution is for any given area because the solution isn’t something that I am aware of,” said Boser. “This is not a report that gives answers to the problems, it is only used as a talking point and something that can increase awareness and draw attention to the problem so that it can be taken care of on a local level.”

Boser says that the challenge in offering a paramount solution is that it cannot work for every single district because each area has a unique set of problems and needs. What the report does, however, is say that teacher diversity is something that needs to be increased everywhere, even in districts where the vast majority of students are white.

“We are advocating for teacher diversity everywhere, even in districts where student populations are largely white,” said Boser. “Having a multicultural teaching force can be beneficial to anyone; it can help to breakdown racial barriers. While teachers who belong to minority groups certainly prove to be role models for corresponding minority students, they can also be beneficial to white students by showing them people of other ethnical backgrounds can also be successful role models as well.”

Trying to Increase Diversity

It may not show in the data, but Worcester is trying to do its part to increase diversity among teachers, even if the talent search needs to move out of state.

According to Stacey DeBoise Luster, Human Resources Director of the Worcester Public School District, the talent search for finding a more diverse group of teachers has gone as far as Florida and Chicago, because oftentimes finding teachers in the area is a struggle.

“Finding a more diverse group of teachers is something that we have always struggled with,” said Luster. “The diversity of students has been increasing in Worcester as of late, but our talent pool of teachers has not been. Because of a lack of diversity among our talent pool in Worcester, we have tried to recruit teachers from other states.”

Recruiting in other states and regions in the nation is not without its own set of challenges. Even if a teacher is hoping to come to Worcester because of the diversity among students, weather and location can often be a factor in coming to the area.

Luster says that although Florida also has a high percentage of Hispanic children, which provides a link between the two areas, teachers from Florida are often hesitant to come up to New England because of the snow and other varying weather patterns. Recently, Chicago has been seen as a closer and easier transition both weather wise and culturally, but still some teachers are hesitant to downgrade in the size of the city that they work in. 

“We have seen quite a bit of interest among teachers in Chicago, a place that we recently recruited in,” said Luster. “Much like Florida, they have a higher percentage of African American and Hispanic teachers graduating, but coming up to Worcester is hard. Teachers often oppose the weather changes and having to downgrade in city size.”

The diversity gap between students and teachers is large, but Luster believes there is no cause for panic. Worcester hopes to see more diverse teachers in the future to provide both a better education and more role models of all ethnical backgrounds. Rather than choosing to look at the gap as a problem, Luster sees it as an opportunity to create new goals for the district. 

“Rather than viewing this gap as a problem or concern, we prefer to look at it as a new goal,” said Luster. “We look at the goal of increasing diversity in the workforces while at the same time providing professional development to our current teachers to make them more culturally competent. Remember, one does not have to be a minority in order to be culturally competent.”

Should the Process Be Rushed?

Few will argue that diversity is a problem, especially when it comes to teaching the increasingly diverse group of youth in Worcester, but there are those that feel that reports like “Teacher Diversity Revisited” should be further analyzed before action is taken.

Bill McCarthy, a member of Massachusetts Republican State Committee representing The First Worcester County, would like to use the research presented in the report as a base for more research to be completed. While agreeing that more diversity may be needed in the Worcester schools, more specified research is needed to see what needs have to be met before rushing to any conclusions. 

“It is clear that this diversity gap is a problem, but we need to do more to ensure that the proper needs are being met,” said McCarthy. “We could match percentages of students and teacher diversity, but at the end of the day, that won’t do much to fit the needs of our students if the people being hired aren’t the right fit.”

Bringing in teachers to fit a minority profile does not equate to bringing in a teacher because they fit the needs of the students. McCarthy feels that even with a growing diversity gap in Worcester public schools, people need to take a step back and actually analyze the student body before hastily bringing in teachers that may not fit their students’ needs. 

Furthermore, using generalized labels such as Hispanic and African American to qualify data points presents a challenge all its own because in a diverse city like Worcester – where many Hispanic children may come from different countries – these labels do not accurately depict the student population. 

“Terms like Hispanic are not homogenous, which presents a problem when saying that we need more Hispanic teachers,” said McCarthy. “We really need to dig down into this statistical evidence to make sure that we are really fitting the needs of our students and not just matching statistics. There is pressure to assimilate the teaching corps right now but we really need to focus on finding people who both want the job and are the right fit for our students.”


Related Slideshow: The 50 Most Diverse High Schools in Massachusetts

Prev Next

#50 Curtis-Tufts HS

Medford, MA

Total enrollment: 67

Percentage of total enrollment

Amer Indian/Alaskan: 0.0%
Asian/Pacific Islander: 4.5%
Black: 27.3%
Hispanic: 13.6%
Two or more races: 0.0%
White: 54.5%

Prev Next

#49 Boston Green Acad.

Boston Green Acad. Horace Mann Charter, Boston, MA

Total enrollment: 324

Percentage of total enrollment

Amer Indian/Alaskan: 0.3%
Asian/Pacific Islander: 2.8%
Black: 53.1%
Hispanic: 28.4%
Two or more races: 0.3%
White: 15.1%

Prev Next

#48 Fitchburg HS

Fitchburg, MA

Total enrollment: 1,116

Percentage of total enrollment

Amer Indian/Alaskan: 0.1%
Asian/Pacific Islander: 7.0%
Black: 7.3%
Hispanic: 44.8%
Two or more races: 4.1%
White: 36.6%

Prev Next

#47 Global Learning

Global Learning Charter Public HS, New Bedford, MA

Total enrollment: 501

Percentage of total enrollment

Amer Indian/Alaskan: 0.8%
Asian/Pacific Islander: 1.0%
Black: 12.6%
Hispanic: 27.9%
Two or more races: 4.2%
White: 53.5%

Prev Next

#46 Lowell Middlesex

Lowell Middlesex Acad. Charter HS, Lowell, MA

Total enrollment: 99

Percentage of total enrollment

Amer Indian/Alaskan: 0.0%
Asian/Pacific Islander: 11.1%
Black: 2.0%
Hispanic: 38.4%
Two or more races: 5.1%
White: 42.4%

Prev Next

#45 Community Academy

Jamaica Plain, MA

Total enrollment: 67

Percentage of total enrollment

Amer Indian/Alaskan: 0.0%
Asian/Pacific Islander: 0.0%
Black: 40.3%
Hispanic: 16.4%
Two or more races: 3.0%
White: 40.3%

Prev Next

#44 Quincy HS

Quincy, MA

Total enrollment: 1,519

Percentage of total enrollment

Amer Indian/Alaskan: 0.7%
Asian/Pacific Islander: 23.9%
Black: 9.8%
Hispanic: 7.4%
Two or more races: 1.8%
White: 56.3%

Prev Next

#43 Foxborough Regional

Foxborough Reg. Charter HS, Foxborough, MA

Total enrollment: 1,265

Percentage of total enrollment

Amer Indian/Alaskan: 0.0%
Asian/Pacific Islander: 10.4%
Black: 23.8%
Hispanic: 5.1%
Two or more races: 4.5%
White: 56.3%

Prev Next

#42 Boston Collegiate

Boston Collegiate Charter HS, Dorchester, MA

Total enrollment: 632

Percentage of total enrollment

Amer Indian/Alaskan: 0.3%
Asian/Pacific Islander: 1.9%
Black: 25.5%
Hispanic: 15.7%
Two or more races: 2.2%
White: 54.4%

Prev Next

#41 Full Circle HS

Somerville, MA

Total enrollment: 56

Percentage of total enrollment

Amer Indian/Alaskan: 0.0%
Asian/Pacific Islander: 1.8%
Black: 21.4%
Hispanic: 35.7%
Two or more races: 1.8%
White: 39.3%

Prev Next

#40 Waltham Senior HS

Waltham, MA

Total enrollment: 1,389

Percentage of total enrollment

Amer Indian/Alaskan: 0.1%
Asian/Pacific Islander: 6.4%
Black: 11.2%
Hispanic: 30.6%
Two or more races: 2.6%
White: 49.1%

Prev Next

#39 Medford HS

Medford MA

Total enrollment: 1,155

Percentage of total enrollment

Amer Indian/Alaskan: 0.3%
Asian/Pacific Islander: 10.0%
Black: 18.4%
Hispanic: 8.2%
Two or more races: 1.9%
White: 61.9%

Prev Next

#38 Snowden International

Snowden Int'l School at Copley, Boston, MA

Total enrollment: 397

Percentage of total enrollment

Amer Indian/Alaskan: 0.3%
Asian/Pacific Islander: 7.6%
Black: 38.3%
Hispanic: 41.3%
Two or more races: 3.0%
White: 9.6%

Prev Next

#37 Brockton HS

Brockton Champion HS, Brockton, MA

Total enrollment: 194

Percentage of total enrollment

Amer Indian/Alaskan: 0.5%
Asian/Pacific Islander: 1.0%
Black: 41.2%
Hispanic: 19.6%
Two or more races: 2.6%
White: 35.1%

Prev Next

#36 Worcester Tech. HS

Worcester, MA

Total enrollment: 1,358

Percentage of total enrollment

Amer Indian/Alaskan: 0.5%
Asian/Pacific Islander: 5.8%
Black: 12.4%
Hispanic: 34.6%
Two or more races: 2.2%
White: 44.5%

Prev Next

#35 Acad. of the Pac. Rim

Acad. of the Pac. Rim Charter Public HS, Hyde Park MA

Total enrollment: 498

Percentage of total enrollment

Amer Indian/Alaskan: 0.0%
Asian/Pacific Islander: 1.4%
Black: 58.4%
Hispanic: 20.5%
Two or more races: 3.4%
White: 16.3%

Prev Next

#34 Lynn Vocational

Lynn Vocational Tech. Institute, Lynn, MA

Total enrollment: 750

Percentage of total enrollment

Amer Indian/Alaskan: 0.8%
Asian/Pacific Islander: 6.7%
Black: 10.7%
Hispanic: 60.0%
Two or more races: 2.9%
White: 18.9%

Prev Next

#33 Boston Arts Academy

Boston, MA

Total enrollment: 445

Percentage of total enrollment

Amer Indian/Alaskan: 0.4%
Asian/Pacific Islander: 3.1%
Black: 38.7%
Hispanic: 40.0%
Two or more races: 2.2%
White: 15.5%

Prev Next

#32 Greater Lowell

Greater Lowell Reg. Vocational Tech.,  Tyngsborough, MA

Total enrollment: 2,112

Percentage of total enrollment

Amer Indian/Alaskan: 0.5%
Asian/Pacific Islander: 14.8%
Black: 3.9%
Hispanic: 26.6%
Two or more races: 2.6%
White: 51.7%

Prev Next

#31 Amherst Regional HS

Amherst, MA

Total enrollment: 1,004

Percentage of total enrollment

Amer Indian/Alaskan: 0.1%
Asian/Pacific Islander: 10.0%
Black: 8.3%
Hispanic: 12.2%
Two or more races: 8.4%
White: 61.2%

Prev Next

#30 Horace Mann

Horace Mann School for the Deaf, Allston, MA

Total enrollment: 111

Percentage of total enrollment

Amer Indian/Alaskan: 0.0%
Asian/Pacific Islander: 9.0%
Black: 36.0%
Hispanic: 41.4%
Two or more races: 1.8%
White: 11.7%

Prev Next

#29 Everett HS

Everett, MA

Total enrollment: 2,004

Percentage of total enrollment

Amer Indian/Alaskan: 0.3%
Asian/Pacific Islander: 4.9%
Black: 23.9%
Hispanic: 32.4%
Two or more races: 1.0%
White: 37.5%

Prev Next

#28 Lynn English HS

Lynn, MA

Total enrollment: 1,611

Percentage of total enrollment

Amer Indian/Alaskan: 0.1%
Asian/Pacific Islander: 9.9%
Black: 10.8%
Hispanic: 53.0%
Two or more races: 2.2%
White: 24.0%

Prev Next

#27 Boston Latin HS

Boston, MA

Total enrollment: 2,379

Percentage of total enrollment

Amer Indian/Alaskan: 0.0%
Asian/Pacific Islander: 29.1%
Black: 9.5%
Hispanic: 10.6%
Two or more races: 3.1%
White: 47.7%

Prev Next

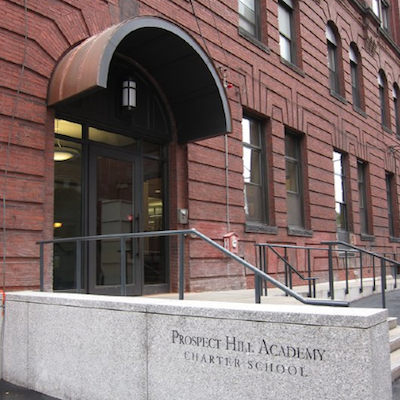
#26 Prospect Hill

Prospect Hill Academy Charter HS, Cambridge, MA

Total enrollment: 1,148

Percentage of total enrollment

Amer Indian/Alaskan: 0.3%
Asian/Pacific Islander: 6.9%
Black: 57.2%
Hispanic: 19.6%
Two or more races: 3.0%
White: 13.0%

Prev Next

#25 Brookline HS

Brookline, MA

Total enrollment: 1,832

Percentage of total enrollment

Amer Indian/Alaskan: 0.0%
Asian/Pacific Islander: 14.8%
Black: 7.9%
Hispanic: 10.3%
Two or more races: 7.0%
White: 60.0%

Prev Next

#24 New Bedford HS

New Bedford, MA

Total enrollment: 2,436

Percentage of total enrollment

Amer Indian/Alaskan: 0.8%
Asian/Pacific Islander: 1.7%
Black: 14.8%
Hispanic: 31.1%
Two or more races: 6.5%
White: 45.0%

Prev Next

#23 Randolph HS

New Bedford, MA

Total enrollment: 746

Percentage of total enrollment

Amer Indian/Alaskan: 0.5%
Asian/Pacific Islander: 17.4%
Black: 58.7%
Hispanic: 9.0%
Two or more races: 1.6%
White: 12.7%

Prev Next

#22 Charlestown HS

Charlestown, MA

Total enrollment: 935

Percentage of total enrollment

Amer Indian/Alaskan: 0.4%
Asian/Pacific Islander: 20.2%
Black: 41.9%
Hispanic: 30.4%
Two or more races: 0.9%
White: 6.2%

Prev Next

#21 Burncoat Senior HS

Worcester, MA

Total enrollment: 996

Percentage of total enrollment

Amer Indian/Alaskan: 0.4%
Asian/Pacific Islander: 5.1%
Black: 17.1%
Hispanic: 39.8%
Two or more races: 2.1%
White: 35.5%

Prev Next

#20 Springfield Ren.

Springfield Renaissance School, Springfield, MA

Total enrollment: 705

Percentage of total enrollment

Amer Indian/Alaskan: 0.1%
Asian/Pacific Islander: 1.4%
Black: 25.5%
Hispanic: 42.6%
Two or more races: 6.1%
White: 24.3%

Prev Next

#19 Sabis International

Sabis Int'l Charter School, Springfield, MA

Total enrollment: 1,574

Percentage of total enrollment

Amer Indian/Alaskan: 0.0%
Asian/Pacific Islander: 2.8%
Black: 30.1%
Hispanic: 33.2%
Two or more races: 5.2%
White: 28.2%

Prev Next

#18 Quincy Upper HS

Boston, MA

Total enrollment: 487

Percentage of total enrollment

Amer Indian/Alaskan: 0.0%
Asian/Pacific Islander: 53.2%
Black: 20.7%
Hispanic: 16.8%
Two or more races: 2.3%
White: 7.0%

Prev Next

#17 Springfield Central HS

Springfield, MA

Total enrollment: 2,086

Percentage of total enrollment

Amer Indian/Alaskan: 0.0%
Asian/Pacific Islander: 6.6%
Black: 24.1%
Hispanic: 49.8%
Two or more races: 3.7%
White: 15.7%

Prev Next

#16 Mystic Valley

Mystic Valley Reg. Charter HS, Malden, MA

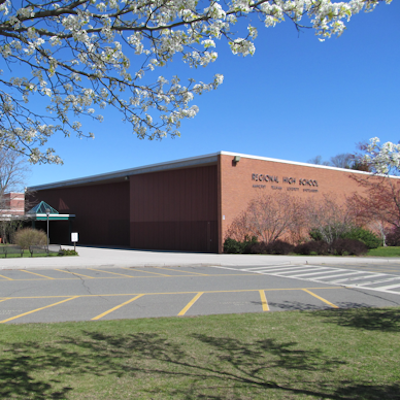
Total enrollment: 1,499

Percentage of total enrollment

Amer Indian/Alaskan: 0.1%
Asian/Pacific Islander: 16.0%
Black: 16.6%
Hispanic: 6.2%
Two or more races: 3.9%
White: 57.2%

Prev Next

#15 Univ. Park Campus

University Park Campus HS, Worcester, MA

Total enrollment: 230

Percentage of total enrollment

Amer Indian/Alaskan: 0.0%
Asian/Pacific Islander: 23.9%
Black: 7.4%
Hispanic: 49.3%
Two or more races: 2.2%
White: 18.3%

Prev Next

#14 Doherty Mem. HS

Worcester, MA

Total enrollment: 1,337

Percentage of total enrollment

Amer Indian/Alaskan: 0.6%
Asian/Pacific Islander: 9.3%
Black: 14.1%
Hispanic: 30.3%
Two or more races: 2.2%
White: 43.4%

Prev Next

#13 North HS

Worcester, MA

Total enrollment: 1,295

Percentage of total enrollment

Amer Indian/Alaskan: 0.2%
Asian/Pacific Islander: 8.3%
Black: 19.2%
Hispanic: 46.4%
Two or more races: 1.7%
White: 24.2%

Prev Next

#12 Lowell HS

Lowell, MA

Total enrollment: 3,054

Percentage of total enrollment

Amer Indian/Alaskan: 0.1%
Asian/Pacific Islander: 32.5%
Black: 9.7%
Hispanic: 24.1%
Two or more races: 1.1%
White: 32.4%

Prev Next

#11 Whaling City Alt.

Whaling City Alternative HS, New Bedford, MA

Total enrollment: 99

Percentage of total enrollment

Amer Indian/Alaskan: 2.0%
Asian/Pacific Islander: 1.0%
Black: 20.2%
Hispanic: 37.4%
Two or more races: 8.1%
White: 31.4%

Prev Next

#10 Somerville HS

Somerville, MA

Total enrollment: 1,265

Percentage of total enrollment

Amer Indian/Alaskan: 0.2%
Asian/Pacific Islander: 11.6%
Black: 15.3%
Hispanic: 39.8%
Two or more races: 0.9%
White: 32.3%

Prev Next

#9 Pioneer Charter

Pioneer Charter School of Science, Everett, MA

Total enrollment: 359

Percentage of total enrollment

Amer Indian/Alaskan: 2.5%
Asian/Pacific Islander: 8.7%
Black: 37.0%
Hispanic: 17.8%
Two or more races: 0.6%
White: 33.4%

Prev Next

#8 Lynn Classical HS

Lynn, MA

Total enrollment: 1,498

Percentage of total enrollment

Amer Indian/Alaskan: 0.1%
Asian/Pacific Islander: 11.8%
Black: 14.3%
Hispanic: 45.6%
Two or more races: 2.7%
White: 25.4%

Prev Next

#7 Cambridge Rindge

Cambridge Rindge and Latin, Cambridge, MA

Total enrollment: 1,741

Percentage of total enrollment

Amer Indian/Alaskan: 0.6%
Asian/Pacific Islander: 11.8%
Black: 33.2%
Hispanic: 14.0%
Two or more races: 3.0%
White: 37.5%

Prev Next

#6 Fecteau-Leary

Fecteau-Leary Junior/Senior HS, Lynn, MA

Total enrollment: 157

Percentage of total enrollment

Amer Indian/Alaskan: 0.6%
Asian/Pacific Islander: 8.3%
Black: 19.7%
Hispanic: 43.3%
Two or more races: 3.8%
White: 24.2%

Prev Next

#5 O'Bryant HS

Roxbury, MA

Total enrollment: 1,353

Percentage of total enrollment

Amer Indian/Alaskan: 0.1%
Asian/Pacific Islander: 21.3%
Black: 37.2%
Hispanic: 28.6%
Two or more races: 1.6%
White: 11.1%

Prev Next

#4 Excel HS

South Boston, MA

Total enrollment: 550

Percentage of total enrollment

Amer Indian/Alaskan: 0.5%
Asian/Pacific Islander: 22.5%
Black: 38.4%
Hispanic: 23.3%
Two or more races: 1.6%
White: 13.6%

Prev Next

#3 South HS

Worcester, MA

Total enrollment: 1,264

Percentage of total enrollment

Amer Indian/Alaskan: 0.6%
Asian/Pacific Islander: 14.9%
Black: 19.6%
Hispanic: 39.2%
Two or more races: 1.7%
White: 24.1%

Prev Next

#2 Boston Latin Acad.

Dorchester, MA

Total enrollment: 1,689

Percentage of total enrollment

Amer Indian/Alaskan: 0.7%
Asian/Pacific Islander: 21.6%
Black: 27.1%
Hispanic: 20.7%
Two or more races: 1.8%
White: 28.2%

Prev Next

#1 Malden HS

Malden, MA

Total enrollment: 1,835

Percentage of total enrollment

Amer Indian/Alaskan: 0.7%
Asian/Pacific Islander: 24.9%
Black: 22.6%
Hispanic: 19.9%
Two or more races: 3.7%
White: 28.3%


Related Articles


Enjoy this post? Share it with others.


X

Stay Connected — Free
Daily Email