Rob Horowitz: The Civil Rights Act, 50 Years Later


 Email to a friend
Permalink
Email to a friend
Permalink
Tuesday, April 15, 2014
Rob Horowitz, GoLocalWorcester MINDSETTER™

The 50th anniversary of the Civil Rights Act of 1964 celebrates the incredible progress the nation has made.
Last week President Obama and former Presidents George W. Bush, Jimmy Carter, and Bill Clinton came together at a Civil Rights Summit held at the LBJ library to mark the 50th anniversary of the adoption of the Civil Rights Act of 1964, and to celebrate the man who was instrumental in bringing it about.
As Robert Caro describes in The Passage of Power, the fourth volume of his epic and authoritative Johnson biography, the newly sworn-in president—just 4 days after the assassination of John F. Kennedy—was determined to make passage of the Civil Rights Act, put forward by Kennedy, his highest legislative priority. He did so over the strong objections of most of his advisers, who argued there was little chance of success and that he would put the rest of his legislative agenda at risk by antagonizing the powerful southerners who controlled most of the committees.
In a speech the next day Johnson said, "No memorial oration or elegy could more eloquently honor President Kennedy’s memory then the earliest possible passage of the civil rights bill for which he fought so long. We have talked long enough in this county about equal rights. We have talked for one hundred years or more. It is time now to write the next chapter, and to write it in the books of law.”
Six months later—in large measure due to Johnson’s expert handing of Congress—the Civil Rights Act overcame its toughest hurdle, the US Senate. He mustered an overwhelming bi-partisan majority of 71 Senators to end a 57-day filibuster, the longest in Senate history. LBJ signed the Civil Rights Act of 1964 into law in early July, making equal access to public accommodations and equal opportunity in employment the law of the land.
Great strides made and to be made
Taken together with the passage of the Voting Rights Act in 1965, the Civil Rights Act of 1964 opened the doors of opportunity and the potential to fully exercise the rights and responsibilities of citizenship to African Americans. Of course, these two strokes of the Presidential pen did not instantly end ingrained prejudice or somehow magically undo the lingering and destructive impacts of generations of disgraceful treatment, including Jim Crow laws and slavery. Still, this law put our nation on the right road. And while there is still a long way to go, the impact has been positive and substantial.
The presence of the first African-American president at the event is an obvious case in point, and President Obama did not shy away from the symbolic significance of his election in his remarks. “Because of the Civil Rights movement, because of the laws President Johnson signed, new doors of opportunity and education swung open for everybody—not all at once, but they swung open. Not just blacks and whites, but also women and Latinos, and Asians and Native Americans, and gay Americans and Americans with a disability. They swung open for you, and they swung open for me. And that’s why I’m standing here today—because of those efforts, because of that legacy.”
Adding a bi-partisan note, President Bush said, "America is a more just and generous country because Lyndon Johnson set his mind to the cause of civil rights."
Both Presidents asserted that the Civil Rights agenda remains unfinished. Obama focused on the need to expand economic opportunities and Bush focused on the need to step up the fight to close the gap in school performance between African-American children and white children.
A huge milestone
LBJ was critical to the adoption of the Civil Rights Act of 1964, but he was far from the only important actor. By challenging the nation to live up to its professed ideals, the Civil Rights Movement—with its hundreds of thousands of marchers, countless acts of individual courage, and farsighted leaders such as Martin Luther King—created the political environment that made success possible. President Kennedy took the decisive step of putting the legislation forward and many other elected officials provided vocal support. Still, LBJ’s willingness to risk political capital and his masterful handling of Congress loom large.
Todd Purdum, author of a book on the topic, called the Civil Rights Act of 1964 and the Voting Rights Act of 1965 “the most important laws of the twentieth century and a high-water mark of shared civic purpose, national unity, and hope that the nation might yet live up to its founding creed.”
It is important to call attention to this 50th anniversary, to celebrate this huge and hard won success that brought us closer to ‘a more perfect union’, and to draw strength for all the big challenges that remain in front of us. The LBJ library is a fitting location.
Rob Horowitz is a strategic and communications consultant who provides general consulting, public relations, direct mail services and polling for national and state issue organizations, various non-profits and elected officials and candidates. He is an Adjunct Professor of Political Science at the University of Rhode Island.
Related Slideshow: The 50 Most Diverse High Schools in Massachusetts

Prev
Next
#50 Curtis-Tufts HS
Medford, MA
Total enrollment: 67
Percentage of total enrollment
Amer Indian/Alaskan: 0.0%
Asian/Pacific Islander: 4.5%
Black: 27.3%
Hispanic: 13.6%
Two or more races: 0.0%
White: 54.5%

Prev
Next
#49 Boston Green Acad.
Boston Green Acad. Horace Mann Charter, Boston, MA
Total enrollment: 324
Percentage of total enrollment
Amer Indian/Alaskan: 0.3%
Asian/Pacific Islander: 2.8%
Black: 53.1%
Hispanic: 28.4%
Two or more races: 0.3%
White: 15.1%

Prev
Next
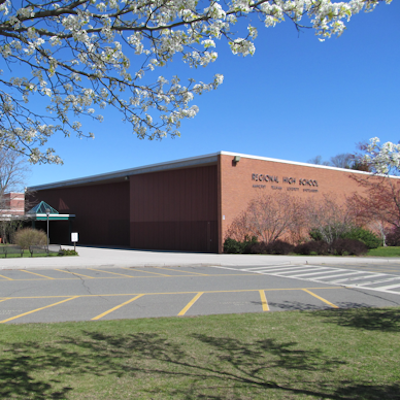
#48 Fitchburg HS
Fitchburg, MA
Total enrollment: 1,116
Percentage of total enrollment
Amer Indian/Alaskan: 0.1%
Asian/Pacific Islander: 7.0%
Black: 7.3%
Hispanic: 44.8%
Two or more races: 4.1%
White: 36.6%

Prev
Next
#47 Global Learning
Global Learning Charter Public HS, New Bedford, MA
Total enrollment: 501
Percentage of total enrollment
Amer Indian/Alaskan: 0.8%
Asian/Pacific Islander: 1.0%
Black: 12.6%
Hispanic: 27.9%
Two or more races: 4.2%
White: 53.5%

Prev
Next
#46 Lowell Middlesex
Lowell Middlesex Acad. Charter HS, Lowell, MA
Total enrollment: 99
Percentage of total enrollment
Amer Indian/Alaskan: 0.0%
Asian/Pacific Islander: 11.1%
Black: 2.0%
Hispanic: 38.4%
Two or more races: 5.1%
White: 42.4%

Prev
Next
#45 Community Academy
Jamaica Plain, MA
Total enrollment: 67
Percentage of total enrollment
Amer Indian/Alaskan: 0.0%
Asian/Pacific Islander: 0.0%
Black: 40.3%
Hispanic: 16.4%
Two or more races: 3.0%
White: 40.3%

Prev
Next
#44 Quincy HS
Quincy, MA
Total enrollment: 1,519
Percentage of total enrollment
Amer Indian/Alaskan: 0.7%
Asian/Pacific Islander: 23.9%
Black: 9.8%
Hispanic: 7.4%
Two or more races: 1.8%
White: 56.3%

Prev
Next
#43 Foxborough Regional
Foxborough Reg. Charter HS, Foxborough, MA
Total enrollment: 1,265
Percentage of total enrollment
Amer Indian/Alaskan: 0.0%
Asian/Pacific Islander: 10.4%
Black: 23.8%
Hispanic: 5.1%
Two or more races: 4.5%
White: 56.3%

Prev
Next
#42 Boston Collegiate
Boston Collegiate Charter HS, Dorchester, MA
Total enrollment: 632
Percentage of total enrollment
Amer Indian/Alaskan: 0.3%
Asian/Pacific Islander: 1.9%
Black: 25.5%
Hispanic: 15.7%
Two or more races: 2.2%
White: 54.4%

Prev
Next
#41 Full Circle HS
Somerville, MA
Total enrollment: 56
Percentage of total enrollment
Amer Indian/Alaskan: 0.0%
Asian/Pacific Islander: 1.8%
Black: 21.4%
Hispanic: 35.7%
Two or more races: 1.8%
White: 39.3%

Prev
Next
#40 Waltham Senior HS
Waltham, MA
Total enrollment: 1,389
Percentage of total enrollment
Amer Indian/Alaskan: 0.1%
Asian/Pacific Islander: 6.4%
Black: 11.2%
Hispanic: 30.6%
Two or more races: 2.6%
White: 49.1%

Prev
Next
#39 Medford HS
Medford MA
Total enrollment: 1,155
Percentage of total enrollment
Amer Indian/Alaskan: 0.3%
Asian/Pacific Islander: 10.0%
Black: 18.4%
Hispanic: 8.2%
Two or more races: 1.9%
White: 61.9%

Prev
Next
#38 Snowden International
Snowden Int'l School at Copley, Boston, MA
Total enrollment: 397
Percentage of total enrollment
Amer Indian/Alaskan: 0.3%
Asian/Pacific Islander: 7.6%
Black: 38.3%
Hispanic: 41.3%
Two or more races: 3.0%
White: 9.6%

Prev
Next
#37 Brockton HS
Brockton Champion HS, Brockton, MA
Total enrollment: 194
Percentage of total enrollment
Amer Indian/Alaskan: 0.5%
Asian/Pacific Islander: 1.0%
Black: 41.2%
Hispanic: 19.6%
Two or more races: 2.6%
White: 35.1%

Prev
Next
#36 Worcester Tech. HS
Worcester, MA
Total enrollment: 1,358
Percentage of total enrollment
Amer Indian/Alaskan: 0.5%
Asian/Pacific Islander: 5.8%
Black: 12.4%
Hispanic: 34.6%
Two or more races: 2.2%
White: 44.5%

Prev
Next
#35 Acad. of the Pac. Rim
Acad. of the Pac. Rim Charter Public HS, Hyde Park MA
Total enrollment: 498
Percentage of total enrollment
Amer Indian/Alaskan: 0.0%
Asian/Pacific Islander: 1.4%
Black: 58.4%
Hispanic: 20.5%
Two or more races: 3.4%
White: 16.3%

Prev
Next
#34 Lynn Vocational
Lynn Vocational Tech. Institute, Lynn, MA
Total enrollment: 750
Percentage of total enrollment
Amer Indian/Alaskan: 0.8%
Asian/Pacific Islander: 6.7%
Black: 10.7%
Hispanic: 60.0%
Two or more races: 2.9%
White: 18.9%

Prev
Next
#33 Boston Arts Academy
Boston, MA
Total enrollment: 445
Percentage of total enrollment
Amer Indian/Alaskan: 0.4%
Asian/Pacific Islander: 3.1%
Black: 38.7%
Hispanic: 40.0%
Two or more races: 2.2%
White: 15.5%

Prev
Next
#32 Greater Lowell
Greater Lowell Reg. Vocational Tech., Tyngsborough, MA
Total enrollment: 2,112
Percentage of total enrollment
Amer Indian/Alaskan: 0.5%
Asian/Pacific Islander: 14.8%
Black: 3.9%
Hispanic: 26.6%
Two or more races: 2.6%
White: 51.7%
Prev
Next
#31 Amherst Regional HS
Amherst, MA
Total enrollment: 1,004
Percentage of total enrollment
Amer Indian/Alaskan: 0.1%
Asian/Pacific Islander: 10.0%
Black: 8.3%
Hispanic: 12.2%
Two or more races: 8.4%
White: 61.2%

Prev
Next
#30 Horace Mann
Horace Mann School for the Deaf, Allston, MA
Total enrollment: 111
Percentage of total enrollment
Amer Indian/Alaskan: 0.0%
Asian/Pacific Islander: 9.0%
Black: 36.0%
Hispanic: 41.4%
Two or more races: 1.8%
White: 11.7%

Prev
Next
#29 Everett HS
Everett, MA
Total enrollment: 2,004
Percentage of total enrollment
Amer Indian/Alaskan: 0.3%
Asian/Pacific Islander: 4.9%
Black: 23.9%
Hispanic: 32.4%
Two or more races: 1.0%
White: 37.5%

Prev
Next
#28 Lynn English HS
Lynn, MA
Total enrollment: 1,611
Percentage of total enrollment
Amer Indian/Alaskan: 0.1%
Asian/Pacific Islander: 9.9%
Black: 10.8%
Hispanic: 53.0%
Two or more races: 2.2%
White: 24.0%
Prev
Next
#27 Boston Latin HS
Boston, MA
Total enrollment: 2,379
Percentage of total enrollment
Amer Indian/Alaskan: 0.0%
Asian/Pacific Islander: 29.1%
Black: 9.5%
Hispanic: 10.6%
Two or more races: 3.1%
White: 47.7%
Prev
Next
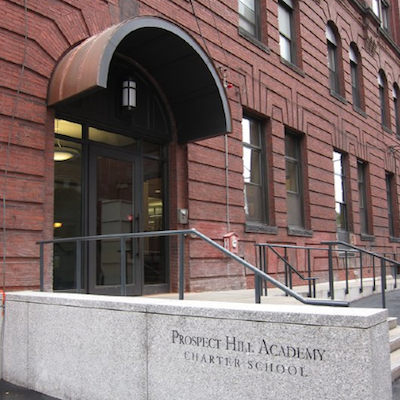
#26 Prospect Hill
Prospect Hill Academy Charter HS, Cambridge, MA
Total enrollment: 1,148
Percentage of total enrollment
Amer Indian/Alaskan: 0.3%
Asian/Pacific Islander: 6.9%
Black: 57.2%
Hispanic: 19.6%
Two or more races: 3.0%
White: 13.0%

Prev
Next
#25 Brookline HS
Brookline, MA
Total enrollment: 1,832
Percentage of total enrollment
Amer Indian/Alaskan: 0.0%
Asian/Pacific Islander: 14.8%
Black: 7.9%
Hispanic: 10.3%
Two or more races: 7.0%
White: 60.0%

Prev
Next
#24 New Bedford HS
New Bedford, MA
Total enrollment: 2,436
Percentage of total enrollment
Amer Indian/Alaskan: 0.8%
Asian/Pacific Islander: 1.7%
Black: 14.8%
Hispanic: 31.1%
Two or more races: 6.5%
White: 45.0%

Prev
Next
#23 Randolph HS
New Bedford, MA
Total enrollment: 746
Percentage of total enrollment
Amer Indian/Alaskan: 0.5%
Asian/Pacific Islander: 17.4%
Black: 58.7%
Hispanic: 9.0%
Two or more races: 1.6%
White: 12.7%

Prev
Next
#22 Charlestown HS
Charlestown, MA
Total enrollment: 935
Percentage of total enrollment
Amer Indian/Alaskan: 0.4%
Asian/Pacific Islander: 20.2%
Black: 41.9%
Hispanic: 30.4%
Two or more races: 0.9%
White: 6.2%

Prev
Next
#21 Burncoat Senior HS
Worcester, MA
Total enrollment: 996
Percentage of total enrollment
Amer Indian/Alaskan: 0.4%
Asian/Pacific Islander: 5.1%
Black: 17.1%
Hispanic: 39.8%
Two or more races: 2.1%
White: 35.5%

Prev
Next
#20 Springfield Ren.
Springfield Renaissance School, Springfield, MA
Total enrollment: 705
Percentage of total enrollment
Amer Indian/Alaskan: 0.1%
Asian/Pacific Islander: 1.4%
Black: 25.5%
Hispanic: 42.6%
Two or more races: 6.1%
White: 24.3%

Prev
Next
#19 Sabis International
Sabis Int'l Charter School, Springfield, MA
Total enrollment: 1,574
Percentage of total enrollment
Amer Indian/Alaskan: 0.0%
Asian/Pacific Islander: 2.8%
Black: 30.1%
Hispanic: 33.2%
Two or more races: 5.2%
White: 28.2%

Prev
Next
#18 Quincy Upper HS
Boston, MA
Total enrollment: 487
Percentage of total enrollment
Amer Indian/Alaskan: 0.0%
Asian/Pacific Islander: 53.2%
Black: 20.7%
Hispanic: 16.8%
Two or more races: 2.3%
White: 7.0%

Prev
Next
#17 Springfield Central HS
Springfield, MA
Total enrollment: 2,086
Percentage of total enrollment
Amer Indian/Alaskan: 0.0%
Asian/Pacific Islander: 6.6%
Black: 24.1%
Hispanic: 49.8%
Two or more races: 3.7%
White: 15.7%
Prev
Next
#16 Mystic Valley
Mystic Valley Reg. Charter HS, Malden, MA
Total enrollment: 1,499
Percentage of total enrollment
Amer Indian/Alaskan: 0.1%
Asian/Pacific Islander: 16.0%
Black: 16.6%
Hispanic: 6.2%
Two or more races: 3.9%
White: 57.2%

Prev
Next
#15 Univ. Park Campus
University Park Campus HS, Worcester, MA
Total enrollment: 230
Percentage of total enrollment
Amer Indian/Alaskan: 0.0%
Asian/Pacific Islander: 23.9%
Black: 7.4%
Hispanic: 49.3%
Two or more races: 2.2%
White: 18.3%

Prev
Next
#14 Doherty Mem. HS
Worcester, MA
Total enrollment: 1,337
Percentage of total enrollment
Amer Indian/Alaskan: 0.6%
Asian/Pacific Islander: 9.3%
Black: 14.1%
Hispanic: 30.3%
Two or more races: 2.2%
White: 43.4%

Prev
Next
#13 North HS
Worcester, MA
Total enrollment: 1,295
Percentage of total enrollment
Amer Indian/Alaskan: 0.2%
Asian/Pacific Islander: 8.3%
Black: 19.2%
Hispanic: 46.4%
Two or more races: 1.7%
White: 24.2%

Prev
Next
#12 Lowell HS
Lowell, MA
Total enrollment: 3,054
Percentage of total enrollment
Amer Indian/Alaskan: 0.1%
Asian/Pacific Islander: 32.5%
Black: 9.7%
Hispanic: 24.1%
Two or more races: 1.1%
White: 32.4%

Prev
Next
#11 Whaling City Alt.
Whaling City Alternative HS, New Bedford, MA
Total enrollment: 99
Percentage of total enrollment
Amer Indian/Alaskan: 2.0%
Asian/Pacific Islander: 1.0%
Black: 20.2%
Hispanic: 37.4%
Two or more races: 8.1%
White: 31.4%

Prev
Next
#10 Somerville HS
Somerville, MA
Total enrollment: 1,265
Percentage of total enrollment
Amer Indian/Alaskan: 0.2%
Asian/Pacific Islander: 11.6%
Black: 15.3%
Hispanic: 39.8%
Two or more races: 0.9%
White: 32.3%

Prev
Next
#9 Pioneer Charter
Pioneer Charter School of Science, Everett, MA
Total enrollment: 359
Percentage of total enrollment
Amer Indian/Alaskan: 2.5%
Asian/Pacific Islander: 8.7%
Black: 37.0%
Hispanic: 17.8%
Two or more races: 0.6%
White: 33.4%

Prev
Next
#8 Lynn Classical HS
Lynn, MA
Total enrollment: 1,498
Percentage of total enrollment
Amer Indian/Alaskan: 0.1%
Asian/Pacific Islander: 11.8%
Black: 14.3%
Hispanic: 45.6%
Two or more races: 2.7%
White: 25.4%

Prev
Next
#7 Cambridge Rindge
Cambridge Rindge and Latin, Cambridge, MA
Total enrollment: 1,741
Percentage of total enrollment
Amer Indian/Alaskan: 0.6%
Asian/Pacific Islander: 11.8%
Black: 33.2%
Hispanic: 14.0%
Two or more races: 3.0%
White: 37.5%

Prev
Next
#6 Fecteau-Leary
Fecteau-Leary Junior/Senior HS, Lynn, MA
Total enrollment: 157
Percentage of total enrollment
Amer Indian/Alaskan: 0.6%
Asian/Pacific Islander: 8.3%
Black: 19.7%
Hispanic: 43.3%
Two or more races: 3.8%
White: 24.2%

Prev
Next
#5 O'Bryant HS
Roxbury, MA
Total enrollment: 1,353
Percentage of total enrollment
Amer Indian/Alaskan: 0.1%
Asian/Pacific Islander: 21.3%
Black: 37.2%
Hispanic: 28.6%
Two or more races: 1.6%
White: 11.1%

Prev
Next
#4 Excel HS
South Boston, MA
Total enrollment: 550
Percentage of total enrollment
Amer Indian/Alaskan: 0.5%
Asian/Pacific Islander: 22.5%
Black: 38.4%
Hispanic: 23.3%
Two or more races: 1.6%
White: 13.6%

Prev
Next
#3 South HS
Worcester, MA
Total enrollment: 1,264
Percentage of total enrollment
Amer Indian/Alaskan: 0.6%
Asian/Pacific Islander: 14.9%
Black: 19.6%
Hispanic: 39.2%
Two or more races: 1.7%
White: 24.1%

Prev
Next
#2 Boston Latin Acad.
Dorchester, MA
Total enrollment: 1,689
Percentage of total enrollment
Amer Indian/Alaskan: 0.7%
Asian/Pacific Islander: 21.6%
Black: 27.1%
Hispanic: 20.7%
Two or more races: 1.8%
White: 28.2%

Prev
Next
#1 Malden HS
Malden, MA
Total enrollment: 1,835
Percentage of total enrollment
Amer Indian/Alaskan: 0.7%
Asian/Pacific Islander: 24.9%
Black: 22.6%
Hispanic: 19.9%
Two or more races: 3.7%
White: 28.3%
Related Articles
Enjoy this post? Share it with others.
Email to a friend
Permalink


Follow us on Pinterest Google + Facebook Twitter See It Read It