The Top High Schools in Central MA 2014


 Email to a friend
Permalink
Email to a friend
Permalink
Saturday, June 21, 2014
Nicholas Handy, GoLocalWorcester Contributor
GoLocalWorcester has released its third Annual Top High Schools in Central Massachusetts based on a propriety ranking of test scores and school data for the definitive look at secondary schools in the Commonwealth -- and for 2014, top honors went to Advanced Math and Science Academy Charter School.
GoLocal spoke with five of the top ten schools to gather insight about the keys to their success. Many of the schools looked to the future, offering their thoughts on what their school needs to do to climb to the top spot on next year’s list. To be one of the top high schools in Central Massachusetts, many factors must come together, including the students, faculty, and the community.
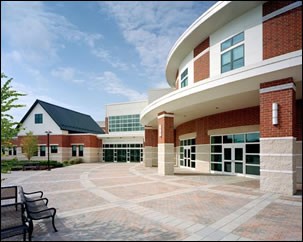
#3 Westborough High School - Westborough
Westborough High School ranked third in the Central Massachusetts rankings and 26th statewide. The high school currently has a student population of 1,053, serving all of the students from grades 9-12 in the Westborough Public School District.
“I attribute the success of our school to the teachers and students who make teaching and learning a priority,” said Principal Brian Callaghan, of his school’s success. “Both make a huge effort to make connections with each other and the skills and content in the curriculum.”
Callaghan acknowledges the loss of time attributed to keeping up with both state and national testing as one of the biggest hurdles to overcome moving forward. While time may be lost due to these tests, Callaghan states that the school’s curriculum and assessments are helping students to achieve high test scores.
“We have made great strides aligning our curriculum and assessments at each grade level; that is, making sure that every student at each grade level in a subject area receives a guaranteed curriculum,” said Callaghan. “This brings focus to teaching and ensures what is learned is truly relevant to real-world experiences.”
#5 Hopkinton High School - Hopkinton
Ranked fifth in Central Massachusetts and 53rd statewide, Principal Evan Bishop attributes three big areas to the success of his school: committed students, a caring staff, and a supportive community.
“We have a hardworking group of people involved with this school which is helping to move us in the right direction,” said Bishop. “We have a great culture of students and adults which creates a great atmosphere for learning.”
Looking toward the future, Bishop wants to create a less stressful environment for students Hopkinton High. Offering students the occasional homework free weekend or vacation, as well as opportunities to de-stress during the week are all beneficial ways to keeping a student body relaxed.
“There will always be some form of stress in people’s lives, but we want to give students the tools to properly cope,” said Bishop. “We have really tried to focus on the stress levels of out student body because we have noticed that stress levels can be high among our students.”
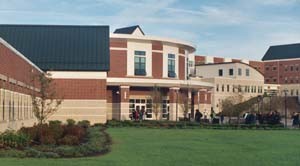
#6 Groton-Dunstable Regional High School - Groton
Groton-Dunstable Regional High School, located in Groton, took sixth place in the Central Mass. rankings and 62nd overall in the state. The school serves over 800 high school students coming from both the Groton and Dunstable area.
“First and foremost, our success is attributed to the students; they come willing and ready to learn every day,” said Principal Michael Mastrullo. “We pride ourselves on academic competition; we want to push our students so that they can perform to the best of their abilities. We also have a very dedicated faculty that cares deeply about the students and their academics.”
While having a dedicated student body and staff, Mastrullo cites a small budget as a primary concern for the school moving forward. Mastrullo is always looking for ways to improve Groton-Dunstable – including more teacher development and better ways to prepare students for life after high school – but says that the current school culture has been leading the drive.
“This may sound cliché, but this really is a great place to come to work and school,” said Mastrullo. “There is a great culture of mutual respect between the students and the faculty. The students make this school a great place to work every day.”
#7 Tantasqua Regional Senior High School – Fiskdale
Tantasqua Principal Michael Lucas attributes the success of his school – which ranked seventh on the Central Massachusetts list and 63rd on the statewide list – to a hardworking faculty in combination with a dedicated administration, which allows for students to continue to learn and achieve.
“We are very proud of our students,” said Lucas. “We really benefit from having a great and well-rounded community. We have great athletic and performing arts programs, as well as a variety of clubs and activities. We really try to push to find a passion for every student.”
In addition to having many extracurricular options for students to find a hobby or passion, Tantasqua has also expanded their AP course offering and has improved graduation rates.
“We have definitely made a lot of progress in improving graduation rates and assisting students that are designated as ‘at risk’,” said Lucas. “We are currently undergoing a self evaluation so that we can look at everything that we need to improve. We want to work more on academic progress tracking to make sure that our students are continuing to progress.”
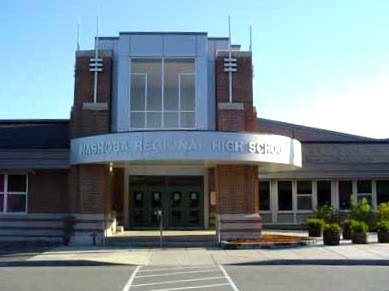
#8 Nashoba Regional High School – Bolton
Nashoba Regional High School came in eighth on the Central Massachusetts list and 76th on the statewide list. The regional high school serves over 1,000 students in the cities of Bolton, Lancaster, and Stow.
Parry Graham – who has served as the principal of Nashoba Regional High School since the 2012-2013 school year – attributes the school’s success to the dedication of the teachers, the support of the community, and the hard work and talents of the student body.
“We have put a lot of energy and resources into adding new opportunities for students in the future – from innovative interdisciplinary courses to expanded programming in the arts and computer sciences,” said Graham. “I think that our biggest challenge going forward, as is true in so many high schools, is continuing to make sure that all of our students are able to be successful, no matter their achievement level or post-high school plans.”
To hear from some of the top high schools in Massachusetts, go here.
Related Slideshow: Central MA High Schools—2014 Rankings
Add link to methodology post.
Prev
Next
#59 Tantasqua Regional Vocational
Fiskdale, MA
2014 Overall MA Rank: #328
Enrollment (2010–2011): 460
Testing
Proficient or Higher ENGLISH LANGUAGE ARTS (ELA) 2011: 93%
Proficient or Higher MATH 2011: 72%
Proficient or Higher SCIENCE 2011: 54%
Average Total SAT Score: 1453
2014 performance at a glance
Student to Teacher Ratio (2010–2011): 38.1
4-Year Graduation Rates (2010): 89.3%
Spending per Student (2009–2010, by District): $12,985

Prev
Next
#58 North High
Worcester, MA
2014 Overall MA Rank: #321
Enrollment (2010–2011): 1295
Testing
Proficient or Higher ENGLISH LANGUAGE ARTS (ELA) 2011: 71%
Proficient or Higher MATH 2011: 48%
Proficient or Higher SCIENCE 2011: 34%
Average Total SAT Score: 1272
2014 performance at a glance
Student to Teacher Ratio (2010–2011): 17.9
4-Year Graduation Rates (2010): 65.2%
Spending per Student (2009–2010, by District): $13,489

Prev
Next
#57 Southbridge High
Southbridge, MA
2014 Overall MA Rank: #315
Enrollment (2010–2011): 472
Testing
Proficient or Higher ENGLISH LANGUAGE ARTS (ELA) 2011: 73%
Proficient or Higher MATH 2011: 46%
Proficient or Higher SCIENCE 2011: 45%
Average Total SAT Score: 1179
2014 performance at a glance
Student to Teacher Ratio (2010–2011): 13.8
4-Year Graduation Rates (2010): 84.4%
Spending per Student (2009–2010, by District): $12,894

Prev
Next
#56 Claremont Academy
Worcester, MA
2014 Overall MA Rank: #309
Enrollment (2010–2011): 267
Testing
Proficient or Higher ENGLISH LANGUAGE ARTS (ELA) 2011: 73%
Proficient or Higher MATH 2011: 45%
Proficient or Higher SCIENCE 2011: 27%
Average Total SAT Score: 1258
2014 performance at a glance
Student to Teacher Ratio (2010–2011): 12
4-Year Graduation Rates (2010): 72.5%
Spending per Student (2009–2010, by District): $13,489

Prev
Next
#55 South High Community
Worcester, MA
2014 Overall MA Rank: #306
Enrollment (2010–2011): 1264
Testing
Proficient or Higher ENGLISH LANGUAGE ARTS (ELA) 2011: 78%
Proficient or Higher MATH 2011: 56%
Proficient or Higher SCIENCE 2011: 44%
Average Total SAT Score: 1309
2014 performance at a glance
Student to Teacher Ratio (2010–2011): 15.2
4-Year Graduation Rates (2010): 64.7%
Spending per Student (2009–2010, by District): $13,489

Prev
Next
#54 Fitchburg High
Fitchburg, MA
2014 Overall MA Rank: #299
Enrollment (2010–2011): 1116
Testing
Proficient or Higher ENGLISH LANGUAGE ARTS (ELA) 2011: 83%
Proficient or Higher MATH 2011: 66%
Proficient or Higher SCIENCE 2011: 46%
Average Total SAT Score: 1294
2014 performance at a glance
Student to Teacher Ratio (2010–2011): 14.5
4-Year Graduation Rates (2010): 82.8%
Spending per Student (2009–2010, by District): $12,681

Prev
Next
#53 Burncoat Senior High
Worcester, MA
2014 Overall MA Rank: #295
Enrollment (2010–2011): 996
Testing
Proficient or Higher ENGLISH LANGUAGE ARTS (ELA) 2011: 78%
Proficient or Higher MATH 2011: 61%
Proficient or Higher SCIENCE 2011: 38%
Average Total SAT Score: 1340
2014 performance at a glance
Student to Teacher Ratio (2010–2011): 12.6
4-Year Graduation Rates (2010): 72.2%
Spending per Student (2009–2010, by District): $13,489

Prev
Next
#52 Ware Junior/Senior High School
Ware, MA
2014 Overall MA Rank: #277
Enrollment (2010–2011): 280
Testing
Proficient or Higher ENGLISH LANGUAGE ARTS (ELA) 2011: 86%
Proficient or Higher MATH 2011: 71%
Proficient or Higher SCIENCE 2011: 63%
Average Total SAT Score: 1429
2014 performance at a glance
Student to Teacher Ratio (2010–2011): 13.2
4-Year Graduation Rates (2010): 76.5%
Spending per Student (2009–2010, by District): $11,919

Prev
Next
#51 Doherty Memorial High
Worcester, MA
2014 Overall MA Rank: #275
Enrollment (2010–2011): 1337
Testing
Proficient or Higher ENGLISH LANGUAGE ARTS (ELA) 2011: 86%
Proficient or Higher MATH 2011: 71%
Proficient or Higher SCIENCE 2011: 62%
Average Total SAT Score: 1417
2014 performance at a glance
Student to Teacher Ratio (2010–2011): 14.8
4-Year Graduation Rates (2010): 83.2%
Spending per Student (2009–2010, by District): $13,489

Prev
Next
#50 Worcester Technical High
Worcester, MA
2014 Overall MA Rank: #271
Enrollment (2010–2011): 1358
Testing
Proficient or Higher ENGLISH LANGUAGE ARTS (ELA) 2011: 92%
Proficient or Higher MATH 2011: 84%
Proficient or Higher SCIENCE 2011: 59%
Average Total SAT Score: 1249
2014 performance at a glance
Student to Teacher Ratio (2010–2011): 11.8
4-Year Graduation Rates (2010): 95%
Spending per Student (2009–2010, by District): $13,489

Prev
Next
#49 Bartlett Jr Sr High School
Webster, MA
2014 Overall MA Rank: #270
Enrollment (2010–2011): 472
Testing
Proficient or Higher ENGLISH LANGUAGE ARTS (ELA) 2011: 93%
Proficient or Higher MATH 2011: 81%
Proficient or Higher SCIENCE 2011: 55%
Average Total SAT Score: 1387
2014 performance at a glance
Student to Teacher Ratio (2010–2011): 12.5
4-Year Graduation Rates (2010): 70%
Spending per Student (2009–2010, by District): $12,786

Prev
Next
#48 Murdock Middle/High
Winchendon, MA
2014 Overall MA Rank: #265
Enrollment (2010–2011): 325
Testing
Proficient or Higher ENGLISH LANGUAGE ARTS (ELA) 2011: 80%
Proficient or Higher MATH 2011: 60%
Proficient or Higher SCIENCE 2011: 52%
Average Total SAT Score: 1483
2014 performance at a glance
Student to Teacher Ratio (2010–2011): 11.7
4-Year Graduation Rates (2010): 91%
Spending per Student (2009–2010, by District): $12,737

Prev
Next
#47 David Prouty High
Spencer, MA
2014 Overall MA Rank: #262
Enrollment (2010–2011): 473
Testing
Proficient or Higher ENGLISH LANGUAGE ARTS (ELA) 2011: 90%
Proficient or Higher MATH 2011: 82%
Proficient or Higher SCIENCE 2011: 54%
Average Total SAT Score: 1468
2014 performance at a glance
Student to Teacher Ratio (2010–2011): 14.5
4-Year Graduation Rates (2010): 87.7%
Spending per Student (2009–2010, by District): $12,290

Prev
Next
#46 Athol-Royalston High
Athol, MA
2014 Overall MA Rank: #254
Enrollment (2010–2011): 378
Testing
Proficient or Higher ENGLISH LANGUAGE ARTS (ELA) 2011: 90%
Proficient or Higher MATH 2011: 72%
Proficient or Higher SCIENCE 2011: 76%
Average Total SAT Score: 1364
2014 performance at a glance
Student to Teacher Ratio (2010–2011): 11.9
4-Year Graduation Rates (2010): 81.9%
Spending per Student (2009–2010, by District): $13,679
Prev
Next
#45 Leominster Senior High
Leominster, MA
2014 Overall MA Rank: #253
Enrollment (2010–2011): 1105
Testing
Proficient or Higher ENGLISH LANGUAGE ARTS (ELA) 2011: 91%
Proficient or Higher MATH 2011: 74%
Proficient or Higher SCIENCE 2011: 82%
Average Total SAT Score: 1472
2014 performance at a glance
Student to Teacher Ratio (2010–2011): 15.6
4-Year Graduation Rates (2010): 90.4%
Spending per Student (2009–2010, by District): $12,233

Prev
Next
#44 University Pk Campus School
Worcester, MA
2014 Overall MA Rank: #249
Enrollment (2010–2011): 148
Testing
Proficient or Higher ENGLISH LANGUAGE ARTS (ELA) 2011: 94%
Proficient or Higher MATH 2011: 74%
Proficient or Higher SCIENCE 2011: 62%
Average Total SAT Score: 1384
2014 performance at a glance
Student to Teacher Ratio (2010–2011): 13.3
4-Year Graduation Rates (2010): 100%
Spending per Student (2009–2010, by District): $13,489

Prev
Next
#43 Clinton Senior High
Clinton, MA
2014 Overall MA Rank: #246
Enrollment (2010–2011): 466
Testing
Proficient or Higher ENGLISH LANGUAGE ARTS (ELA) 2011: 95%
Proficient or Higher MATH 2011: 79%
Proficient or Higher SCIENCE 2011: 65%
Average Total SAT Score: 1473
2014 performance at a glance
Student to Teacher Ratio (2010–2011): 13.6
4-Year Graduation Rates (2010): 89.1%
Spending per Student (2009–2010, by District): $11,273

Prev
Next
#42 Oxford High
Oxford, MA
2014 Overall MA Rank: #241
Enrollment (2010–2011): 450
Testing
Proficient or Higher ENGLISH LANGUAGE ARTS (ELA) 2011: 84%
Proficient or Higher MATH 2011: 69%
Proficient or Higher SCIENCE 2011: 67%
Average Total SAT Score: 1504
2014 performance at a glance
Student to Teacher Ratio (2010–2011): 11.5
4-Year Graduation Rates (2010): 80.6%
Spending per Student (2009–2010, by District): $11,955

Prev
Next
#41 Uxbridge High
Uxbridge, MA
2014 Overall MA Rank: #234
Enrollment (2010–2011): 478
Testing
Proficient or Higher ENGLISH LANGUAGE ARTS (ELA) 2011: 87%
Proficient or Higher MATH 2011: 76%
Proficient or Higher SCIENCE 2011: 77%
Average Total SAT Score: 1548
2014 performance at a glance
Student to Teacher Ratio (2010–2011): 15.8
4-Year Graduation Rates (2010): 89.2%
Spending per Student (2009–2010, by District): $12,074

Prev
Next
#40 Northbridge High
Whitinsville, MA
2014 Overall MA Rank: #222
Enrollment (2010–2011): 677
Testing
Proficient or Higher ENGLISH LANGUAGE ARTS (ELA) 2011: 92%
Proficient or Higher MATH 2011: 74%
Proficient or Higher SCIENCE 2011: 75%
Average Total SAT Score: 1525
2014 performance at a glance
Student to Teacher Ratio (2010–2011): 12.6
4-Year Graduation Rates (2010): 84.2%
Spending per Student (2009–2010, by District): $11,129

Prev
Next
#39 Douglas High School
Douglas, MA
2014 Overall MA Rank: #220
Enrollment (2010–2011): 573
Testing
Proficient or Higher ENGLISH LANGUAGE ARTS (ELA) 2011: 93%
Proficient or Higher MATH 2011: 81%
Proficient or Higher SCIENCE 2011: 78%
Average Total SAT Score: 1538
2014 performance at a glance
Student to Teacher Ratio (2010–2011): 13.1
4-Year Graduation Rates (2010): 85.1%
Spending per Student (2009–2010, by District): $10,070

Prev
Next
#38 Shepherd Hill Regional High
Dudley, MA
2014 Overall MA Rank: #219
Enrollment (2010–2011): 1106
Testing
Proficient or Higher ENGLISH LANGUAGE ARTS (ELA) 2011: 93%
Proficient or Higher MATH 2011: 86%
Proficient or Higher SCIENCE 2011: 84%
Average Total SAT Score: 1523
2014 performance at a glance
Student to Teacher Ratio (2010–2011): 15.1
4-Year Graduation Rates (2010): 93.9%
Spending per Student (2009–2010, by District): $10,624

Prev
Next
#37 Milford High
Milford, MA
2014 Overall MA Rank: #216
Enrollment (2010–2011): 1111
Testing
Proficient or Higher ENGLISH LANGUAGE ARTS (ELA) 2011: 92%
Proficient or Higher MATH 2011: 80%
Proficient or Higher SCIENCE 2011: 72%
Average Total SAT Score: 1512
2014 performance at a glance
Student to Teacher Ratio (2010–2011): 13.6
4-Year Graduation Rates (2010): 87.5%
Spending per Student (2009–2010, by District): $12,284

Prev
Next
#36 Abby Kelley Foster Charter
Worcester, MA
2014 Overall MA Rank: #214
Enrollment (2010–2011): 343
Testing
Proficient or Higher ENGLISH LANGUAGE ARTS (ELA) 2011: 100%
Proficient or Higher MATH 2011: 88%
Proficient or Higher SCIENCE 2011: 70%
Average Total SAT Score: 1386
2014 performance at a glance
Student to Teacher Ratio (2010–2011): 12.8
4-Year Graduation Rates (2010): 92%
Spending per Student (2009–2010, by District): $13,489

Prev
Next
#35 Gardner High
Gardner, MA
2014 Overall MA Rank: #201
Enrollment (2010–2011): 563
Testing
Proficient or Higher ENGLISH LANGUAGE ARTS (ELA) 2011: 94%
Proficient or Higher MATH 2011: 80%
Proficient or Higher SCIENCE 2011: 70%
Average Total SAT Score: 1534
2014 performance at a glance
Student to Teacher Ratio (2010–2011): 12.4
4-Year Graduation Rates (2010): 87.4%
Spending per Student (2009–2010, by District): $11,310

Prev
Next
#34 Narragansett Regional High
Baldwinville, MA
2014 Overall MA Rank: #199
Enrollment (2010–2011): 385
Testing
Proficient or Higher ENGLISH LANGUAGE ARTS (ELA) 2011: 97%
Proficient or Higher MATH 2011: 82%
Proficient or Higher SCIENCE 2011: 82%
Average Total SAT Score: 1438
2014 performance at a glance
Student to Teacher Ratio (2010–2011): 11.7
4-Year Graduation Rates (2010): 92.6%
Spending per Student (2009–2010, by District): $11,738

Prev
Next
#33 North Brookfield High
North Brookfield, MA
2014 Overall MA Rank: #198
Enrollment (2010–2011): 223
Testing
Proficient or Higher ENGLISH LANGUAGE ARTS (ELA) 2011: 97%
Proficient or Higher MATH 2011: 77%
Proficient or Higher SCIENCE 2011: 71%
Average Total SAT Score: 1448
2014 performance at a glance
Student to Teacher Ratio (2010–2011): 10.1
4-Year Graduation Rates (2010): 84.6%
Spending per Student (2009–2010, by District): $12,295

Prev
Next
#32 North Central Charter Essential
Fitchburg, MA
2014 Overall MA Rank: #197
Enrollment (2010–2011): 219
Testing
Proficient or Higher ENGLISH LANGUAGE ARTS (ELA) 2011: 95%
Proficient or Higher MATH 2011: 89%
Proficient or Higher SCIENCE 2011: 54%
Average Total SAT Score: 1429
2014 performance at a glance
Student to Teacher Ratio (2010–2011): 9.4
4-Year Graduation Rates (2010): 86.3%
Spending per Student (2009–2010, by District): $12,681

Prev
Next
#31 Montachusett Regional Vocational
Fitchburg, MA
2014 Overall MA Rank: #193
Enrollment (2010–2011): 1433
Testing
Proficient or Higher ENGLISH LANGUAGE ARTS (ELA) 2011: 95%
Proficient or Higher MATH 2011: 80%
Proficient or Higher SCIENCE 2011: 72%
Average Total SAT Score: 1387
2014 performance at a glance
Student to Teacher Ratio (2010–2011): 13.9
4-Year Graduation Rates (2010): 96.6%
Spending per Student (2009–2010, by District): $17,281

Prev
Next
#30 Assabet Valley Vocational High
Marlborough, MA
2014 Overall MA Rank: #183
Enrollment (2010–2011): 1026
Testing
Proficient or Higher ENGLISH LANGUAGE ARTS (ELA) 2011: 93%
Proficient or Higher MATH 2011: 77%
Proficient or Higher SCIENCE 2011: 76%
Average Total SAT Score: 1322
2014 performance at a glance
Student to Teacher Ratio (2010–2011): 10.6
4-Year Graduation Rates (2010): 90.8%
Spending per Student (2009–2010, by District): $17,360

Prev
Next
#29 North Middlesex Regional
Townsend, MA
2014 Overall MA Rank: #182
Enrollment (2010–2011): 956
Testing
Proficient or Higher ENGLISH LANGUAGE ARTS (ELA) 2011: 97%
Proficient or Higher MATH 2011: 87%
Proficient or Higher SCIENCE 2011: 79%
Average Total SAT Score: 1545
2014 performance at a glance
Student to Teacher Ratio (2010–2011): 14.4
4-Year Graduation Rates (2010): 93.7%
Spending per Student (2009–2010, by District): $11,461

Prev
Next
#28 West Boylston Jr Sr High
West Boylston, MA
2014 Overall MA Rank: #178
Enrollment (2010–2011): 278
Testing
Proficient or Higher ENGLISH LANGUAGE ARTS (ELA) 2011: 94%
Proficient or Higher MATH 2011: 83%
Proficient or Higher SCIENCE 2011: 81%
Average Total SAT Score: 1470
2014 performance at a glance
Student to Teacher Ratio (2010–2011): 11.4
4-Year Graduation Rates (2010): 89.1%
Spending per Student (2009–2010, by District): $12,384

Prev
Next
#27 Quaboag Regional High
Warren, MA
2014 Overall MA Rank: #177
Enrollment (2010–2011): 364
Testing
Proficient or Higher ENGLISH LANGUAGE ARTS (ELA) 2011: 92%
Proficient or Higher MATH 2011: 86%
Proficient or Higher SCIENCE 2011: 81%
Average Total SAT Score: 1521
2014 performance at a glance
Student to Teacher Ratio (2010–2011): 11.8
4-Year Graduation Rates (2010): 79.4%
Spending per Student (2009–2010, by District): $12,077

Prev
Next
#26 Southwich-Tolland Regional High
Southwick, MA
2014 Overall MA Rank: #172
Enrollment (2010–2011): 544
Testing
Proficient or Higher ENGLISH LANGUAGE ARTS (ELA) 2011: 94%
Proficient or Higher MATH 2011: 81%
Proficient or Higher SCIENCE 2011: 75%
Average Total SAT Score: 1552
2014 performance at a glance
Student to Teacher Ratio (2010–2011): 12
4-Year Graduation Rates (2010): 88.1%
Spending per Student (2009–2010, by District): $11,547

Prev
Next
#25 Grafton High School
Grafton, MA
2014 Overall MA Rank: #168
Enrollment (2010–2011): 767
Testing
Proficient or Higher ENGLISH LANGUAGE ARTS (ELA) 2011: 93%
Proficient or Higher MATH 2011: 89%
Proficient or Higher SCIENCE 2011: 87%
Average Total SAT Score: 1578
2014 performance at a glance
Student to Teacher Ratio (2010–2011): 13.7
4-Year Graduation Rates (2010): 93.4%
Spending per Student (2009–2010, by District): $10,064

Prev
Next
#24 Sutton High School
Sutton, MA
2014 Overall MA Rank: #164
Enrollment (2010–2011): 418
Testing
Proficient or Higher ENGLISH LANGUAGE ARTS (ELA) 2011: 94%
Proficient or Higher MATH 2011: 91%
Proficient or Higher SCIENCE 2011: 75%
Average Total SAT Score: 1596
2014 performance at a glance
Student to Teacher Ratio (2010–2011): 14.6
4-Year Graduation Rates (2010): 94.1%
Spending per Student (2009–2010, by District): $11,329

Prev
Next
#23 Marlborough High
Marlborough, MA
2014 Overall MA Rank: #162
Enrollment (2010–2011): 1075
Testing
Proficient or Higher ENGLISH LANGUAGE ARTS (ELA) 2011: 89%
Proficient or Higher MATH 2011: 79%
Proficient or Higher SCIENCE 2011: 67%
Average Total SAT Score: 1515
2014 performance at a glance
Student to Teacher Ratio (2010–2011): 10.7
4-Year Graduation Rates (2010): 84.1%
Spending per Student (2009–2010, by District): $14,198

Prev
Next
#22 Hopedale Jr. Sr. High
Hopedale, MA
2014 Overall MA Rank: #161
Enrollment (2010–2011): 344
Testing
Proficient or Higher ENGLISH LANGUAGE ARTS (ELA) 2011: 100%
Proficient or Higher MATH 2011: 94%
Proficient or Higher SCIENCE 2011: 84%
Average Total SAT Score: 1519
2014 performance at a glance
Student to Teacher Ratio (2010–2011): 13.4
4-Year Graduation Rates (2010): 96.6%
Spending per Student (2009–2010, by District): $10,448

Prev
Next
#21 Bay Path Regional Vocation Technical
Charlton, MA
2014 Overall MA Rank: #156
Enrollment (2010–2011): 1104
Testing
Proficient or Higher ENGLISH LANGUAGE ARTS (ELA) 2011: 93%
Proficient or Higher MATH 2011: 82%
Proficient or Higher SCIENCE 2011: 75%
Average Total SAT Score: 1346
2014 performance at a glance
Student to Teacher Ratio (2010–2011): 9.9
4-Year Graduation Rates (2010): 90.5%
Spending per Student (2009–2010, by District): $16,966

Prev
Next
#20 Hudson High
Hudson, MA
2014 Overall MA Rank: #154
Enrollment (2010–2011): 1113
Testing
Proficient or Higher ENGLISH LANGUAGE ARTS (ELA) 2011: 98%
Proficient or Higher MATH 2011: 91%
Proficient or Higher SCIENCE 2011: 73%
Average Total SAT Score: 1475
2014 performance at a glance
Student to Teacher Ratio (2010–2011): 12
4-Year Graduation Rates (2010): 90.2%
Spending per Student (2009–2010, by District): $13,294

Prev
Next
#19 Wachusset Regional High
Holden, MA
2014 Overall MA Rank: #152
Enrollment (2010–2011): 2095
Testing
Proficient or Higher ENGLISH LANGUAGE ARTS (ELA) 2011: 96%
Proficient or Higher MATH 2011: 91%
Proficient or Higher SCIENCE 2011: 83%
Average Total SAT Score: 1617
2014 performance at a glance
Student to Teacher Ratio (2010–2011): 15.1
4-Year Graduation Rates (2010): 93%
Spending per Student (2009–2010, by District): $10,817

Prev
Next
#18 Millbury Junior/Senior High
Millbury, MA
2014 Overall MA Rank: #150
Enrollment (2010–2011): 713
Testing
Proficient or Higher ENGLISH LANGUAGE ARTS (ELA) 2011: 95%
Proficient or Higher MATH 2011: 80%
Proficient or Higher SCIENCE 2011: 68%
Average Total SAT Score: 1517
2014 performance at a glance
Student to Teacher Ratio (2010–2011): 11.2
4-Year Graduation Rates (2010): 89.7%
Spending per Student (2009–2010, by District): $13,444

Prev
Next
#17 Oakmont Regional High School
Ashburnham, MA
2014 Overall MA Rank: #148
Enrollment (2010–2011): 689
Testing
Proficient or Higher ENGLISH LANGUAGE ARTS (ELA) 2011: 99%
Proficient or Higher MATH 2011: 89%
Proficient or Higher SCIENCE 2011: 86%
Average Total SAT Score: 1567
2014 performance at a glance
Student to Teacher Ratio (2010–2011): 15.3
4-Year Graduation Rates (2010): 95.1%
Spending per Student (2009–2010, by District): $12,027

Prev
Next
#16 Ayer Shirley Regional High School
Ayer, MA
2014 Overall MA Rank: #146
Enrollment (2010–2011): 325
Testing
Proficient or Higher ENGLISH LANGUAGE ARTS (ELA) 2011: 95%
Proficient or Higher MATH 2011: 88%
Proficient or Higher SCIENCE 2011: 85%
Average Total SAT Score: 1447
2014 performance at a glance
Student to Teacher Ratio (2010–2011): 10.3
4-Year Graduation Rates (2010): 83.8%
Spending per Student (2009–2010, by District): $13,040

Prev
Next
#15 Auburn Senior High
Auburn, MA
2014 Overall MA Rank: #144
Enrollment (2010–2011): 689
Testing
Proficient or Higher ENGLISH LANGUAGE ARTS (ELA) 2011: 95%
Proficient or Higher MATH 2011: 89%
Proficient or Higher SCIENCE 2011: 84%
Average Total SAT Score: 1489
2014 performance at a glance
Student to Teacher Ratio (2010–2011): 11.8
4-Year Graduation Rates (2010): 94.7%
Spending per Student (2009–2010, by District): $12,211

Prev
Next
#14 Nipmuc Regional High
Upton, MA
2014 Overall MA Rank: #134
Enrollment (2010–2011): 667
Testing
Proficient or Higher ENGLISH LANGUAGE ARTS (ELA) 2011: 95%
Proficient or Higher MATH 2011: 94%
Proficient or Higher SCIENCE 2011: 90%
Average Total SAT Score: 1557
2014 performance at a glance
Student to Teacher Ratio (2010–2011): 13.8
4-Year Graduation Rates (2010): 96.8%
Spending per Student (2009–2010, by District): $11,242

Prev
Next
#13 Shrewsbury Sr. High
Shrewsbury, MA
2014 Overall MA Rank: #117
Enrollment (2010–2011): 1647
Testing
Proficient or Higher ENGLISH LANGUAGE ARTS (ELA) 2011: 98%
Proficient or Higher MATH 2011: 94%
Proficient or Higher SCIENCE 2011: 90%
Average Total SAT Score: 1677
2014 performance at a glance
Student to Teacher Ratio (2010–2011): 16.9
4-Year Graduation Rates (2010): 94.7%
Spending per Student (2009–2010, by District): $11,318

Prev
Next
#12 Lunenburg High
Lunenburg, MA
2014 Overall MA Rank: #104
Enrollment (2010–2011): 577
Testing
Proficient or Higher ENGLISH LANGUAGE ARTS (ELA) 2011: 97%
Proficient or Higher MATH 2011: 96%
Proficient or Higher SCIENCE 2011: 97%
Average Total SAT Score: 1546
2014 performance at a glance
Student to Teacher Ratio (2010–2011): 13
4-Year Graduation Rates (2010): 96.8%
Spending per Student (2009–2010, by District): $11,448

Prev
Next
#11 Blackstone Valley Reg. Vocational
Upton, MA
2014 Overall MA Rank: #85
Enrollment (2010–2011): 1164
Testing
Proficient or Higher ENGLISH LANGUAGE ARTS (ELA) 2011: 99%
Proficient or Higher MATH 2011: 95%
Proficient or Higher SCIENCE 2011: 91%
Average Total SAT Score: 1434
2014 performance at a glance
Student to Teacher Ratio (2010–2011): 13.2
4-Year Graduation Rates (2010): 97.8%
Spending per Student (2009–2010, by District): $17,131

Prev
Next
#10 Tahanto Regional High
Boylston), MA
2014 Overall MA Rank: #80
Enrollment (2010–2011): 282
Testing
Proficient or Higher ENGLISH LANGUAGE ARTS (ELA) 2011: 95%
Proficient or Higher MATH 2011: 89%
Proficient or Higher SCIENCE 2011: 94%
Average Total SAT Score: 1613
2014 performance at a glance
Student to Teacher Ratio (2010–2011): 12.7
4-Year Graduation Rates (2010): 86.9%
Spending per Student (2009–2010, by District): $13,409
Prev
Next
#9 Nashoba Regional
Bolton, MA
2014 Overall MA Rank: #76
Enrollment (2010–2011): 1033
Testing
Proficient or Higher ENGLISH LANGUAGE ARTS (ELA) 2011: 95%
Proficient or Higher MATH 2011: 92%
Proficient or Higher SCIENCE 2011: 87%
Average Total SAT Score: 1680
2014 performance at a glance
Student to Teacher Ratio (2010–2011): 14.6
4-Year Graduation Rates (2010): 95.1%
Spending per Student (2009–2010, by District): $12,686
Prev
Next
#8 Leominster High School & Ctr for Tech
Leominster, MA
2014 Overall MA Rank: #64
Enrollment (2010–2011): 34
Testing
Proficient or Higher ENGLISH LANGUAGE ARTS (ELA) 2011: 85%
Proficient or Higher MATH 2011: 82%
Proficient or Higher SCIENCE 2011: 75%
Average Total SAT Score: 1416
2014 performance at a glance
Student to Teacher Ratio (2010–2011):
4-Year Graduation Rates (2010): 92.6%
Spending per Student (2009–2010, by District): $12,233
Prev
Next
#7 Tantasqua Regional Sr. High
Fiskdale, MA
2014 Overall MA Rank: #63
Enrollment (2010–2011): 756
Testing
Proficient or Higher ENGLISH LANGUAGE ARTS (ELA) 2011: 97%
Proficient or Higher MATH 2011: 86%
Proficient or Higher SCIENCE 2011: 75%
Average Total SAT Score: 1607
2014 performance at a glance
Student to Teacher Ratio (2010–2011): 9.7
4-Year Graduation Rates (2010): 94.9%
Spending per Student (2009–2010, by District): $12,985

Prev
Next
#6 Groton Dunstable Regional
Groton, MA
2014 Overall MA Rank: #62
Enrollment (2010–2011): 870
Testing
Proficient or Higher ENGLISH LANGUAGE ARTS (ELA) 2011: 99%
Proficient or Higher MATH 2011: 98%
Proficient or Higher SCIENCE 2011: 95%
Average Total SAT Score: 1664
2014 performance at a glance
Student to Teacher Ratio (2010–2011): 14.6
4-Year Graduation Rates (2010): 97%
Spending per Student (2009–2010, by District): $12,261

Prev
Next
#5 Hopkinton High
Hopkinton, MA
2014 Overall MA Rank: #53
Enrollment (2010–2011): 1150
Testing
Proficient or Higher ENGLISH LANGUAGE ARTS (ELA) 2011: 98%
Proficient or Higher MATH 2011: 95%
Proficient or Higher SCIENCE 2011: 93%
Average Total SAT Score: 1688
2014 performance at a glance
Student to Teacher Ratio (2010–2011): 14.5
4-Year Graduation Rates (2010): 99.2%
Spending per Student (2009–2010, by District): $12,472

Prev
Next
#4 Algonquin Regional High
Northborough, MA
2014 Overall MA Rank: #33
Enrollment (2010–2011): 1471
Testing
Proficient or Higher ENGLISH LANGUAGE ARTS (ELA) 2011: 99%
Proficient or Higher MATH 2011: 95%
Proficient or Higher SCIENCE 2011: 96%
Average Total SAT Score: 1715
2014 performance at a glance
Student to Teacher Ratio (2010–2011): 14.3
4-Year Graduation Rates (2010): 97.5%
Spending per Student (2009–2010, by District): $13,900
Prev
Next
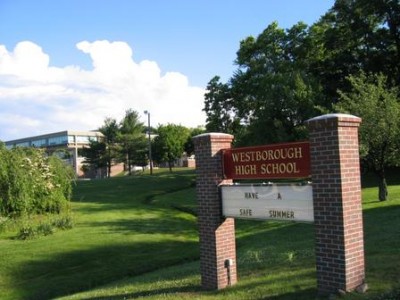
#3 Westborough High
Westborough, MA
2014 Overall MA Rank: #26
Enrollment (2010–2011): 1053
Testing
Proficient or Higher ENGLISH LANGUAGE ARTS (ELA) 2011: 97%
Proficient or Higher MATH 2011: 93%
Proficient or Higher SCIENCE 2011: 95%
Average Total SAT Score: 1716
2014 performance at a glance
Student to Teacher Ratio (2010–2011): 12.6
4-Year Graduation Rates (2010): 96.6%
Spending per Student (2009–2010, by District): $14,545
Prev
Next
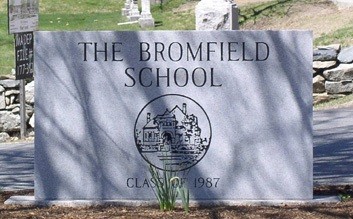
#2 Bromfield
Harvard, MA
2014 Overall MA Rank: #13
Enrollment (2010–2011): 709
Testing
Proficient or Higher ENGLISH LANGUAGE ARTS (ELA) 2011: 100%
Proficient or Higher MATH 2011: 97%
Proficient or Higher SCIENCE 2011: 97%
Average Total SAT Score: 1824
2014 performance at a glance
Student to Teacher Ratio (2010–2011): 13.8
4-Year Graduation Rates (2010): 98.3%
Spending per Student (2009–2010, by District): $13,984

Prev
Next
#1 Advanced Math and Science Academy
Marlborough, MA
2014 Overall MA Rank: #6
Enrollment (2010–2011): 567
Testing
Proficient or Higher ENGLISH LANGUAGE ARTS (ELA) 2011: 100%
Proficient or Higher MATH 2011: 100%
Proficient or Higher SCIENCE 2011: 98%
Average Total SAT Score: 1825
2014 performance at a glance
Student to Teacher Ratio (2010–2011): 11.5
4-Year Graduation Rates (2010): 98.6%
Spending per Student (2009–2010, by District): $14,198
Related Articles
Enjoy this post? Share it with others.
Email to a friend
Permalink


Follow us on Pinterest Google + Facebook Twitter See It Read It