Monfredo: State of the School Address: A Celebration of Accomplishments and Vision for the Future


 Email to a friend
Permalink
Email to a friend
Permalink
Saturday, November 01, 2014
John Monfredo, GoLocalWorcester MINDSETTER™

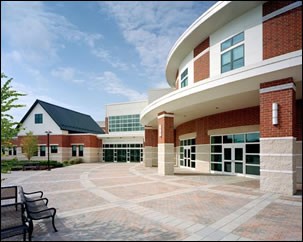
North High School
There is no greater asset in this city than placing a value on the importance of education. Thus, Dr. Melinda Boone who just recently gave her fifth STATE OF THE SCHOOLS ADDRESS at North High School did a wonderful job for her remarks were forthright, informative, and held a few surprises.
It was five years ago that I encouraged Dr. Boone to consider giving a State of the Schools address to the public as a way of increasing the importance of education in this community and most significantly to bring about more partnerships into the mix.
Her overall theme this year was “How are the children doing?” The data did show that the students’ progress (over 24 500 students) is trending in the right direction. The four year graduation rate has improved with over 73.4 % graduating in four years. However, Dr. Boone stated, “The district is moving toward its goal of 90% graduation rate.” Equally as important is that the dropout rate has continued to decline for it is down to 3.4% as compared to 6.0% in 2007.
On the academic front 45% of the schools in Worcester are at Level 1 or 2 and that is an increase from 33% in 2010. Dr. Boone went on to praise the Level one schools that have had five consecutive years of Level one … West Tatnuck, Worcester Arts Magnet School, and Worcester Technical High School. New to level one this year are Norrback Avenue and Union Hill.
Other schools that have been at Level one or two for the past three years are Belmont Street School, Columbus Park, Flagg Street, Forest Grove, Gates Lane, Heard Street, Jacob Hiatt Magnet, Lake View, May Street, Midland Street, Nelson Place, Thorndyke Road, University Park Campus School, and Wawecus Road.
Most importantly, Dr. Boone spoke about the Worcester Public Schools continuing to lower the achievement gap and the growth fact that has continued to take increase. “Progress is happening and is sustainable and consistent,” declared Dr. Boone. She then spoke about the increase in the schools MCAS scores but did confirm that reading on grade level by the end of grade three “is still a challenge for us.” She went on say that the system is neither satisfied nor complacent, but proud of what has been accomplished.
Dr. Boone also praised the accomplishments of South High for increasing their advanced placement tests taken by students to 137% and the passing of the test increased by 110% in seven years.
As a system, the participation in AP exams has increased in the district. There has been a doubling of participation since 2006 but the performance has not lost ground. “We still have almost one half who are achieving a qualifying score on the exams.”
Perhaps the part of her address that received the most attention from the media was her announcement that in November she will be presenting to the School Committee the framework for an Academy for Advanced Learners that will be housed at Doherty Memorial High School. The pilot program will serve a maximum of 250 students in grades 9-12 with admission based on a rigorous set of enrollment criteria and expectations. She went on to say that the proposal is being drawn from the best programs serving students across the Commonwealth including Boston College High School, Massachusetts Academy of Math and Science at WPI, exam schools in Boston, and the Honors College Program at UMass Amherst.
Stating that the work of the Goddard Scholars Academy at Sullivan Middle with their most successful program has moved gifted education to new heights in this city. Dr. Boone acknowledged the system is now in a position to begin to take a leadership role in serving advanced and gifted students.
These remarks were supported in an editorial by the Worcester Telegram and Gazette who also stated that the movement has been slow. Also, the editorial board felt that the idea was slow in coming and that the idea only received a tepid reception from the School Committee last Spring.
What the editorial failed to mention was that the School Committee was grappling with budget cuts and not enough resources to meet the needs in our school system. Cuts in teachers, tutors and class sizes of over 27 in the elementary classes needed to be addressed. Thus, the school system was not ready to move forward with any concrete recommendations.
School Committee members and the public now need to hear the details on this new initiative and again ask can we afford the school at this time, do we have the necessary resources within the system to make it happen and will the financing have an impact on the rest of the school system? We will all be looking forward to the particulars as the plan unfolds.
Other note worthy initiatives mentioned by Dr. Boone include an articulated collaboration with higher education – Worcester State University and Quinsigamond Community College, along with United Families for Change in Worcester in advancing the focus on educator development and in generating interest in teaching along with greater diversity within our teacher ranks. More details will need to be forthcoming in the future as just what the impact will be on the school system.
The last expanded vision mentioned was a recommendation by Dr. Boone recommending to the School Committee. During its next budget cycle she would like a reorganization of the Quadrant Managers position moving them to be to School Portfolio Managers. She also requested a third School Portfolio Manager whose primary responsibilities will focus on the career aspects of college and career readiness.
I’m sure that as a School System and as a city we will all be eager to hear more details about these visionary changes and how they will impact the children. As the theme of the address stated…Let’s do all that we can to make sure that all of the children continue to grow into productive adults. We must all make sure that the answer to Dr. Boone’s question, “How are the children doing?” is positive…The children are doing well!
Related Slideshow: Central MA High Schools—2014 Rankings
Add link to methodology post.
Prev
Next
#59 Tantasqua Regional Vocational
Fiskdale, MA
2014 Overall MA Rank: #328
Enrollment (2010–2011): 460
Testing
Proficient or Higher ENGLISH LANGUAGE ARTS (ELA) 2011: 93%
Proficient or Higher MATH 2011: 72%
Proficient or Higher SCIENCE 2011: 54%
Average Total SAT Score: 1453
2014 performance at a glance
Student to Teacher Ratio (2010–2011): 38.1
4-Year Graduation Rates (2010): 89.3%
Spending per Student (2009–2010, by District): $12,985

Prev
Next
#58 North High
Worcester, MA
2014 Overall MA Rank: #321
Enrollment (2010–2011): 1295
Testing
Proficient or Higher ENGLISH LANGUAGE ARTS (ELA) 2011: 71%
Proficient or Higher MATH 2011: 48%
Proficient or Higher SCIENCE 2011: 34%
Average Total SAT Score: 1272
2014 performance at a glance
Student to Teacher Ratio (2010–2011): 17.9
4-Year Graduation Rates (2010): 65.2%
Spending per Student (2009–2010, by District): $13,489

Prev
Next
#57 Southbridge High
Southbridge, MA
2014 Overall MA Rank: #315
Enrollment (2010–2011): 472
Testing
Proficient or Higher ENGLISH LANGUAGE ARTS (ELA) 2011: 73%
Proficient or Higher MATH 2011: 46%
Proficient or Higher SCIENCE 2011: 45%
Average Total SAT Score: 1179
2014 performance at a glance
Student to Teacher Ratio (2010–2011): 13.8
4-Year Graduation Rates (2010): 84.4%
Spending per Student (2009–2010, by District): $12,894

Prev
Next
#56 Claremont Academy
Worcester, MA
2014 Overall MA Rank: #309
Enrollment (2010–2011): 267
Testing
Proficient or Higher ENGLISH LANGUAGE ARTS (ELA) 2011: 73%
Proficient or Higher MATH 2011: 45%
Proficient or Higher SCIENCE 2011: 27%
Average Total SAT Score: 1258
2014 performance at a glance
Student to Teacher Ratio (2010–2011): 12
4-Year Graduation Rates (2010): 72.5%
Spending per Student (2009–2010, by District): $13,489

Prev
Next
#55 South High Community
Worcester, MA
2014 Overall MA Rank: #306
Enrollment (2010–2011): 1264
Testing
Proficient or Higher ENGLISH LANGUAGE ARTS (ELA) 2011: 78%
Proficient or Higher MATH 2011: 56%
Proficient or Higher SCIENCE 2011: 44%
Average Total SAT Score: 1309
2014 performance at a glance
Student to Teacher Ratio (2010–2011): 15.2
4-Year Graduation Rates (2010): 64.7%
Spending per Student (2009–2010, by District): $13,489

Prev
Next
#54 Fitchburg High
Fitchburg, MA
2014 Overall MA Rank: #299
Enrollment (2010–2011): 1116
Testing
Proficient or Higher ENGLISH LANGUAGE ARTS (ELA) 2011: 83%
Proficient or Higher MATH 2011: 66%
Proficient or Higher SCIENCE 2011: 46%
Average Total SAT Score: 1294
2014 performance at a glance
Student to Teacher Ratio (2010–2011): 14.5
4-Year Graduation Rates (2010): 82.8%
Spending per Student (2009–2010, by District): $12,681

Prev
Next
#53 Burncoat Senior High
Worcester, MA
2014 Overall MA Rank: #295
Enrollment (2010–2011): 996
Testing
Proficient or Higher ENGLISH LANGUAGE ARTS (ELA) 2011: 78%
Proficient or Higher MATH 2011: 61%
Proficient or Higher SCIENCE 2011: 38%
Average Total SAT Score: 1340
2014 performance at a glance
Student to Teacher Ratio (2010–2011): 12.6
4-Year Graduation Rates (2010): 72.2%
Spending per Student (2009–2010, by District): $13,489

Prev
Next
#52 Ware Junior/Senior High School
Ware, MA
2014 Overall MA Rank: #277
Enrollment (2010–2011): 280
Testing
Proficient or Higher ENGLISH LANGUAGE ARTS (ELA) 2011: 86%
Proficient or Higher MATH 2011: 71%
Proficient or Higher SCIENCE 2011: 63%
Average Total SAT Score: 1429
2014 performance at a glance
Student to Teacher Ratio (2010–2011): 13.2
4-Year Graduation Rates (2010): 76.5%
Spending per Student (2009–2010, by District): $11,919

Prev
Next
#51 Doherty Memorial High
Worcester, MA
2014 Overall MA Rank: #275
Enrollment (2010–2011): 1337
Testing
Proficient or Higher ENGLISH LANGUAGE ARTS (ELA) 2011: 86%
Proficient or Higher MATH 2011: 71%
Proficient or Higher SCIENCE 2011: 62%
Average Total SAT Score: 1417
2014 performance at a glance
Student to Teacher Ratio (2010–2011): 14.8
4-Year Graduation Rates (2010): 83.2%
Spending per Student (2009–2010, by District): $13,489

Prev
Next
#50 Worcester Technical High
Worcester, MA
2014 Overall MA Rank: #271
Enrollment (2010–2011): 1358
Testing
Proficient or Higher ENGLISH LANGUAGE ARTS (ELA) 2011: 92%
Proficient or Higher MATH 2011: 84%
Proficient or Higher SCIENCE 2011: 59%
Average Total SAT Score: 1249
2014 performance at a glance
Student to Teacher Ratio (2010–2011): 11.8
4-Year Graduation Rates (2010): 95%
Spending per Student (2009–2010, by District): $13,489

Prev
Next
#49 Bartlett Jr Sr High School
Webster, MA
2014 Overall MA Rank: #270
Enrollment (2010–2011): 472
Testing
Proficient or Higher ENGLISH LANGUAGE ARTS (ELA) 2011: 93%
Proficient or Higher MATH 2011: 81%
Proficient or Higher SCIENCE 2011: 55%
Average Total SAT Score: 1387
2014 performance at a glance
Student to Teacher Ratio (2010–2011): 12.5
4-Year Graduation Rates (2010): 70%
Spending per Student (2009–2010, by District): $12,786

Prev
Next
#48 Murdock Middle/High
Winchendon, MA
2014 Overall MA Rank: #265
Enrollment (2010–2011): 325
Testing
Proficient or Higher ENGLISH LANGUAGE ARTS (ELA) 2011: 80%
Proficient or Higher MATH 2011: 60%
Proficient or Higher SCIENCE 2011: 52%
Average Total SAT Score: 1483
2014 performance at a glance
Student to Teacher Ratio (2010–2011): 11.7
4-Year Graduation Rates (2010): 91%
Spending per Student (2009–2010, by District): $12,737

Prev
Next
#47 David Prouty High
Spencer, MA
2014 Overall MA Rank: #262
Enrollment (2010–2011): 473
Testing
Proficient or Higher ENGLISH LANGUAGE ARTS (ELA) 2011: 90%
Proficient or Higher MATH 2011: 82%
Proficient or Higher SCIENCE 2011: 54%
Average Total SAT Score: 1468
2014 performance at a glance
Student to Teacher Ratio (2010–2011): 14.5
4-Year Graduation Rates (2010): 87.7%
Spending per Student (2009–2010, by District): $12,290

Prev
Next
#46 Athol-Royalston High
Athol, MA
2014 Overall MA Rank: #254
Enrollment (2010–2011): 378
Testing
Proficient or Higher ENGLISH LANGUAGE ARTS (ELA) 2011: 90%
Proficient or Higher MATH 2011: 72%
Proficient or Higher SCIENCE 2011: 76%
Average Total SAT Score: 1364
2014 performance at a glance
Student to Teacher Ratio (2010–2011): 11.9
4-Year Graduation Rates (2010): 81.9%
Spending per Student (2009–2010, by District): $13,679
Prev
Next
#45 Leominster Senior High
Leominster, MA
2014 Overall MA Rank: #253
Enrollment (2010–2011): 1105
Testing
Proficient or Higher ENGLISH LANGUAGE ARTS (ELA) 2011: 91%
Proficient or Higher MATH 2011: 74%
Proficient or Higher SCIENCE 2011: 82%
Average Total SAT Score: 1472
2014 performance at a glance
Student to Teacher Ratio (2010–2011): 15.6
4-Year Graduation Rates (2010): 90.4%
Spending per Student (2009–2010, by District): $12,233

Prev
Next
#44 University Pk Campus School
Worcester, MA
2014 Overall MA Rank: #249
Enrollment (2010–2011): 148
Testing
Proficient or Higher ENGLISH LANGUAGE ARTS (ELA) 2011: 94%
Proficient or Higher MATH 2011: 74%
Proficient or Higher SCIENCE 2011: 62%
Average Total SAT Score: 1384
2014 performance at a glance
Student to Teacher Ratio (2010–2011): 13.3
4-Year Graduation Rates (2010): 100%
Spending per Student (2009–2010, by District): $13,489

Prev
Next
#43 Clinton Senior High
Clinton, MA
2014 Overall MA Rank: #246
Enrollment (2010–2011): 466
Testing
Proficient or Higher ENGLISH LANGUAGE ARTS (ELA) 2011: 95%
Proficient or Higher MATH 2011: 79%
Proficient or Higher SCIENCE 2011: 65%
Average Total SAT Score: 1473
2014 performance at a glance
Student to Teacher Ratio (2010–2011): 13.6
4-Year Graduation Rates (2010): 89.1%
Spending per Student (2009–2010, by District): $11,273

Prev
Next
#42 Oxford High
Oxford, MA
2014 Overall MA Rank: #241
Enrollment (2010–2011): 450
Testing
Proficient or Higher ENGLISH LANGUAGE ARTS (ELA) 2011: 84%
Proficient or Higher MATH 2011: 69%
Proficient or Higher SCIENCE 2011: 67%
Average Total SAT Score: 1504
2014 performance at a glance
Student to Teacher Ratio (2010–2011): 11.5
4-Year Graduation Rates (2010): 80.6%
Spending per Student (2009–2010, by District): $11,955

Prev
Next
#41 Uxbridge High
Uxbridge, MA
2014 Overall MA Rank: #234
Enrollment (2010–2011): 478
Testing
Proficient or Higher ENGLISH LANGUAGE ARTS (ELA) 2011: 87%
Proficient or Higher MATH 2011: 76%
Proficient or Higher SCIENCE 2011: 77%
Average Total SAT Score: 1548
2014 performance at a glance
Student to Teacher Ratio (2010–2011): 15.8
4-Year Graduation Rates (2010): 89.2%
Spending per Student (2009–2010, by District): $12,074

Prev
Next
#40 Northbridge High
Whitinsville, MA
2014 Overall MA Rank: #222
Enrollment (2010–2011): 677
Testing
Proficient or Higher ENGLISH LANGUAGE ARTS (ELA) 2011: 92%
Proficient or Higher MATH 2011: 74%
Proficient or Higher SCIENCE 2011: 75%
Average Total SAT Score: 1525
2014 performance at a glance
Student to Teacher Ratio (2010–2011): 12.6
4-Year Graduation Rates (2010): 84.2%
Spending per Student (2009–2010, by District): $11,129

Prev
Next
#39 Douglas High School
Douglas, MA
2014 Overall MA Rank: #220
Enrollment (2010–2011): 573
Testing
Proficient or Higher ENGLISH LANGUAGE ARTS (ELA) 2011: 93%
Proficient or Higher MATH 2011: 81%
Proficient or Higher SCIENCE 2011: 78%
Average Total SAT Score: 1538
2014 performance at a glance
Student to Teacher Ratio (2010–2011): 13.1
4-Year Graduation Rates (2010): 85.1%
Spending per Student (2009–2010, by District): $10,070

Prev
Next
#38 Shepherd Hill Regional High
Dudley, MA
2014 Overall MA Rank: #219
Enrollment (2010–2011): 1106
Testing
Proficient or Higher ENGLISH LANGUAGE ARTS (ELA) 2011: 93%
Proficient or Higher MATH 2011: 86%
Proficient or Higher SCIENCE 2011: 84%
Average Total SAT Score: 1523
2014 performance at a glance
Student to Teacher Ratio (2010–2011): 15.1
4-Year Graduation Rates (2010): 93.9%
Spending per Student (2009–2010, by District): $10,624

Prev
Next
#37 Milford High
Milford, MA
2014 Overall MA Rank: #216
Enrollment (2010–2011): 1111
Testing
Proficient or Higher ENGLISH LANGUAGE ARTS (ELA) 2011: 92%
Proficient or Higher MATH 2011: 80%
Proficient or Higher SCIENCE 2011: 72%
Average Total SAT Score: 1512
2014 performance at a glance
Student to Teacher Ratio (2010–2011): 13.6
4-Year Graduation Rates (2010): 87.5%
Spending per Student (2009–2010, by District): $12,284

Prev
Next
#36 Abby Kelley Foster Charter
Worcester, MA
2014 Overall MA Rank: #214
Enrollment (2010–2011): 343
Testing
Proficient or Higher ENGLISH LANGUAGE ARTS (ELA) 2011: 100%
Proficient or Higher MATH 2011: 88%
Proficient or Higher SCIENCE 2011: 70%
Average Total SAT Score: 1386
2014 performance at a glance
Student to Teacher Ratio (2010–2011): 12.8
4-Year Graduation Rates (2010): 92%
Spending per Student (2009–2010, by District): $13,489

Prev
Next
#35 Gardner High
Gardner, MA
2014 Overall MA Rank: #201
Enrollment (2010–2011): 563
Testing
Proficient or Higher ENGLISH LANGUAGE ARTS (ELA) 2011: 94%
Proficient or Higher MATH 2011: 80%
Proficient or Higher SCIENCE 2011: 70%
Average Total SAT Score: 1534
2014 performance at a glance
Student to Teacher Ratio (2010–2011): 12.4
4-Year Graduation Rates (2010): 87.4%
Spending per Student (2009–2010, by District): $11,310

Prev
Next
#34 Narragansett Regional High
Baldwinville, MA
2014 Overall MA Rank: #199
Enrollment (2010–2011): 385
Testing
Proficient or Higher ENGLISH LANGUAGE ARTS (ELA) 2011: 97%
Proficient or Higher MATH 2011: 82%
Proficient or Higher SCIENCE 2011: 82%
Average Total SAT Score: 1438
2014 performance at a glance
Student to Teacher Ratio (2010–2011): 11.7
4-Year Graduation Rates (2010): 92.6%
Spending per Student (2009–2010, by District): $11,738

Prev
Next
#33 North Brookfield High
North Brookfield, MA
2014 Overall MA Rank: #198
Enrollment (2010–2011): 223
Testing
Proficient or Higher ENGLISH LANGUAGE ARTS (ELA) 2011: 97%
Proficient or Higher MATH 2011: 77%
Proficient or Higher SCIENCE 2011: 71%
Average Total SAT Score: 1448
2014 performance at a glance
Student to Teacher Ratio (2010–2011): 10.1
4-Year Graduation Rates (2010): 84.6%
Spending per Student (2009–2010, by District): $12,295

Prev
Next
#32 North Central Charter Essential
Fitchburg, MA
2014 Overall MA Rank: #197
Enrollment (2010–2011): 219
Testing
Proficient or Higher ENGLISH LANGUAGE ARTS (ELA) 2011: 95%
Proficient or Higher MATH 2011: 89%
Proficient or Higher SCIENCE 2011: 54%
Average Total SAT Score: 1429
2014 performance at a glance
Student to Teacher Ratio (2010–2011): 9.4
4-Year Graduation Rates (2010): 86.3%
Spending per Student (2009–2010, by District): $12,681

Prev
Next
#31 Montachusett Regional Vocational
Fitchburg, MA
2014 Overall MA Rank: #193
Enrollment (2010–2011): 1433
Testing
Proficient or Higher ENGLISH LANGUAGE ARTS (ELA) 2011: 95%
Proficient or Higher MATH 2011: 80%
Proficient or Higher SCIENCE 2011: 72%
Average Total SAT Score: 1387
2014 performance at a glance
Student to Teacher Ratio (2010–2011): 13.9
4-Year Graduation Rates (2010): 96.6%
Spending per Student (2009–2010, by District): $17,281

Prev
Next
#30 Assabet Valley Vocational High
Marlborough, MA
2014 Overall MA Rank: #183
Enrollment (2010–2011): 1026
Testing
Proficient or Higher ENGLISH LANGUAGE ARTS (ELA) 2011: 93%
Proficient or Higher MATH 2011: 77%
Proficient or Higher SCIENCE 2011: 76%
Average Total SAT Score: 1322
2014 performance at a glance
Student to Teacher Ratio (2010–2011): 10.6
4-Year Graduation Rates (2010): 90.8%
Spending per Student (2009–2010, by District): $17,360

Prev
Next
#29 North Middlesex Regional
Townsend, MA
2014 Overall MA Rank: #182
Enrollment (2010–2011): 956
Testing
Proficient or Higher ENGLISH LANGUAGE ARTS (ELA) 2011: 97%
Proficient or Higher MATH 2011: 87%
Proficient or Higher SCIENCE 2011: 79%
Average Total SAT Score: 1545
2014 performance at a glance
Student to Teacher Ratio (2010–2011): 14.4
4-Year Graduation Rates (2010): 93.7%
Spending per Student (2009–2010, by District): $11,461

Prev
Next
#28 West Boylston Jr Sr High
West Boylston, MA
2014 Overall MA Rank: #178
Enrollment (2010–2011): 278
Testing
Proficient or Higher ENGLISH LANGUAGE ARTS (ELA) 2011: 94%
Proficient or Higher MATH 2011: 83%
Proficient or Higher SCIENCE 2011: 81%
Average Total SAT Score: 1470
2014 performance at a glance
Student to Teacher Ratio (2010–2011): 11.4
4-Year Graduation Rates (2010): 89.1%
Spending per Student (2009–2010, by District): $12,384

Prev
Next
#27 Quaboag Regional High
Warren, MA
2014 Overall MA Rank: #177
Enrollment (2010–2011): 364
Testing
Proficient or Higher ENGLISH LANGUAGE ARTS (ELA) 2011: 92%
Proficient or Higher MATH 2011: 86%
Proficient or Higher SCIENCE 2011: 81%
Average Total SAT Score: 1521
2014 performance at a glance
Student to Teacher Ratio (2010–2011): 11.8
4-Year Graduation Rates (2010): 79.4%
Spending per Student (2009–2010, by District): $12,077

Prev
Next
#26 Southwich-Tolland Regional High
Southwick, MA
2014 Overall MA Rank: #172
Enrollment (2010–2011): 544
Testing
Proficient or Higher ENGLISH LANGUAGE ARTS (ELA) 2011: 94%
Proficient or Higher MATH 2011: 81%
Proficient or Higher SCIENCE 2011: 75%
Average Total SAT Score: 1552
2014 performance at a glance
Student to Teacher Ratio (2010–2011): 12
4-Year Graduation Rates (2010): 88.1%
Spending per Student (2009–2010, by District): $11,547

Prev
Next
#25 Grafton High School
Grafton, MA
2014 Overall MA Rank: #168
Enrollment (2010–2011): 767
Testing
Proficient or Higher ENGLISH LANGUAGE ARTS (ELA) 2011: 93%
Proficient or Higher MATH 2011: 89%
Proficient or Higher SCIENCE 2011: 87%
Average Total SAT Score: 1578
2014 performance at a glance
Student to Teacher Ratio (2010–2011): 13.7
4-Year Graduation Rates (2010): 93.4%
Spending per Student (2009–2010, by District): $10,064

Prev
Next
#24 Sutton High School
Sutton, MA
2014 Overall MA Rank: #164
Enrollment (2010–2011): 418
Testing
Proficient or Higher ENGLISH LANGUAGE ARTS (ELA) 2011: 94%
Proficient or Higher MATH 2011: 91%
Proficient or Higher SCIENCE 2011: 75%
Average Total SAT Score: 1596
2014 performance at a glance
Student to Teacher Ratio (2010–2011): 14.6
4-Year Graduation Rates (2010): 94.1%
Spending per Student (2009–2010, by District): $11,329

Prev
Next
#23 Marlborough High
Marlborough, MA
2014 Overall MA Rank: #162
Enrollment (2010–2011): 1075
Testing
Proficient or Higher ENGLISH LANGUAGE ARTS (ELA) 2011: 89%
Proficient or Higher MATH 2011: 79%
Proficient or Higher SCIENCE 2011: 67%
Average Total SAT Score: 1515
2014 performance at a glance
Student to Teacher Ratio (2010–2011): 10.7
4-Year Graduation Rates (2010): 84.1%
Spending per Student (2009–2010, by District): $14,198

Prev
Next
#22 Hopedale Jr. Sr. High
Hopedale, MA
2014 Overall MA Rank: #161
Enrollment (2010–2011): 344
Testing
Proficient or Higher ENGLISH LANGUAGE ARTS (ELA) 2011: 100%
Proficient or Higher MATH 2011: 94%
Proficient or Higher SCIENCE 2011: 84%
Average Total SAT Score: 1519
2014 performance at a glance
Student to Teacher Ratio (2010–2011): 13.4
4-Year Graduation Rates (2010): 96.6%
Spending per Student (2009–2010, by District): $10,448

Prev
Next
#21 Bay Path Regional Vocation Technical
Charlton, MA
2014 Overall MA Rank: #156
Enrollment (2010–2011): 1104
Testing
Proficient or Higher ENGLISH LANGUAGE ARTS (ELA) 2011: 93%
Proficient or Higher MATH 2011: 82%
Proficient or Higher SCIENCE 2011: 75%
Average Total SAT Score: 1346
2014 performance at a glance
Student to Teacher Ratio (2010–2011): 9.9
4-Year Graduation Rates (2010): 90.5%
Spending per Student (2009–2010, by District): $16,966

Prev
Next
#20 Hudson High
Hudson, MA
2014 Overall MA Rank: #154
Enrollment (2010–2011): 1113
Testing
Proficient or Higher ENGLISH LANGUAGE ARTS (ELA) 2011: 98%
Proficient or Higher MATH 2011: 91%
Proficient or Higher SCIENCE 2011: 73%
Average Total SAT Score: 1475
2014 performance at a glance
Student to Teacher Ratio (2010–2011): 12
4-Year Graduation Rates (2010): 90.2%
Spending per Student (2009–2010, by District): $13,294

Prev
Next
#19 Wachusset Regional High
Holden, MA
2014 Overall MA Rank: #152
Enrollment (2010–2011): 2095
Testing
Proficient or Higher ENGLISH LANGUAGE ARTS (ELA) 2011: 96%
Proficient or Higher MATH 2011: 91%
Proficient or Higher SCIENCE 2011: 83%
Average Total SAT Score: 1617
2014 performance at a glance
Student to Teacher Ratio (2010–2011): 15.1
4-Year Graduation Rates (2010): 93%
Spending per Student (2009–2010, by District): $10,817

Prev
Next
#18 Millbury Junior/Senior High
Millbury, MA
2014 Overall MA Rank: #150
Enrollment (2010–2011): 713
Testing
Proficient or Higher ENGLISH LANGUAGE ARTS (ELA) 2011: 95%
Proficient or Higher MATH 2011: 80%
Proficient or Higher SCIENCE 2011: 68%
Average Total SAT Score: 1517
2014 performance at a glance
Student to Teacher Ratio (2010–2011): 11.2
4-Year Graduation Rates (2010): 89.7%
Spending per Student (2009–2010, by District): $13,444

Prev
Next
#17 Oakmont Regional High School
Ashburnham, MA
2014 Overall MA Rank: #148
Enrollment (2010–2011): 689
Testing
Proficient or Higher ENGLISH LANGUAGE ARTS (ELA) 2011: 99%
Proficient or Higher MATH 2011: 89%
Proficient or Higher SCIENCE 2011: 86%
Average Total SAT Score: 1567
2014 performance at a glance
Student to Teacher Ratio (2010–2011): 15.3
4-Year Graduation Rates (2010): 95.1%
Spending per Student (2009–2010, by District): $12,027

Prev
Next
#16 Ayer Shirley Regional High School
Ayer, MA
2014 Overall MA Rank: #146
Enrollment (2010–2011): 325
Testing
Proficient or Higher ENGLISH LANGUAGE ARTS (ELA) 2011: 95%
Proficient or Higher MATH 2011: 88%
Proficient or Higher SCIENCE 2011: 85%
Average Total SAT Score: 1447
2014 performance at a glance
Student to Teacher Ratio (2010–2011): 10.3
4-Year Graduation Rates (2010): 83.8%
Spending per Student (2009–2010, by District): $13,040

Prev
Next
#15 Auburn Senior High
Auburn, MA
2014 Overall MA Rank: #144
Enrollment (2010–2011): 689
Testing
Proficient or Higher ENGLISH LANGUAGE ARTS (ELA) 2011: 95%
Proficient or Higher MATH 2011: 89%
Proficient or Higher SCIENCE 2011: 84%
Average Total SAT Score: 1489
2014 performance at a glance
Student to Teacher Ratio (2010–2011): 11.8
4-Year Graduation Rates (2010): 94.7%
Spending per Student (2009–2010, by District): $12,211

Prev
Next
#14 Nipmuc Regional High
Upton, MA
2014 Overall MA Rank: #134
Enrollment (2010–2011): 667
Testing
Proficient or Higher ENGLISH LANGUAGE ARTS (ELA) 2011: 95%
Proficient or Higher MATH 2011: 94%
Proficient or Higher SCIENCE 2011: 90%
Average Total SAT Score: 1557
2014 performance at a glance
Student to Teacher Ratio (2010–2011): 13.8
4-Year Graduation Rates (2010): 96.8%
Spending per Student (2009–2010, by District): $11,242

Prev
Next
#13 Shrewsbury Sr. High
Shrewsbury, MA
2014 Overall MA Rank: #117
Enrollment (2010–2011): 1647
Testing
Proficient or Higher ENGLISH LANGUAGE ARTS (ELA) 2011: 98%
Proficient or Higher MATH 2011: 94%
Proficient or Higher SCIENCE 2011: 90%
Average Total SAT Score: 1677
2014 performance at a glance
Student to Teacher Ratio (2010–2011): 16.9
4-Year Graduation Rates (2010): 94.7%
Spending per Student (2009–2010, by District): $11,318

Prev
Next
#12 Lunenburg High
Lunenburg, MA
2014 Overall MA Rank: #104
Enrollment (2010–2011): 577
Testing
Proficient or Higher ENGLISH LANGUAGE ARTS (ELA) 2011: 97%
Proficient or Higher MATH 2011: 96%
Proficient or Higher SCIENCE 2011: 97%
Average Total SAT Score: 1546
2014 performance at a glance
Student to Teacher Ratio (2010–2011): 13
4-Year Graduation Rates (2010): 96.8%
Spending per Student (2009–2010, by District): $11,448

Prev
Next
#11 Blackstone Valley Reg. Vocational
Upton, MA
2014 Overall MA Rank: #85
Enrollment (2010–2011): 1164
Testing
Proficient or Higher ENGLISH LANGUAGE ARTS (ELA) 2011: 99%
Proficient or Higher MATH 2011: 95%
Proficient or Higher SCIENCE 2011: 91%
Average Total SAT Score: 1434
2014 performance at a glance
Student to Teacher Ratio (2010–2011): 13.2
4-Year Graduation Rates (2010): 97.8%
Spending per Student (2009–2010, by District): $17,131

Prev
Next
#10 Tahanto Regional High
Boylston), MA
2014 Overall MA Rank: #80
Enrollment (2010–2011): 282
Testing
Proficient or Higher ENGLISH LANGUAGE ARTS (ELA) 2011: 95%
Proficient or Higher MATH 2011: 89%
Proficient or Higher SCIENCE 2011: 94%
Average Total SAT Score: 1613
2014 performance at a glance
Student to Teacher Ratio (2010–2011): 12.7
4-Year Graduation Rates (2010): 86.9%
Spending per Student (2009–2010, by District): $13,409
Prev
Next
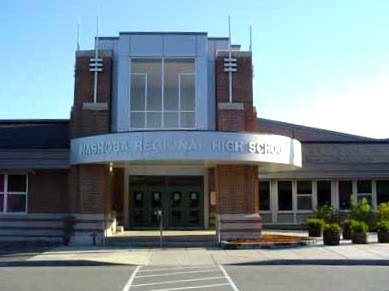
#9 Nashoba Regional
Bolton, MA
2014 Overall MA Rank: #76
Enrollment (2010–2011): 1033
Testing
Proficient or Higher ENGLISH LANGUAGE ARTS (ELA) 2011: 95%
Proficient or Higher MATH 2011: 92%
Proficient or Higher SCIENCE 2011: 87%
Average Total SAT Score: 1680
2014 performance at a glance
Student to Teacher Ratio (2010–2011): 14.6
4-Year Graduation Rates (2010): 95.1%
Spending per Student (2009–2010, by District): $12,686
Prev
Next
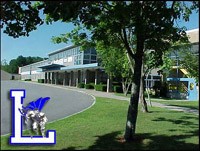
#8 Leominster High School & Ctr for Tech
Leominster, MA
2014 Overall MA Rank: #64
Enrollment (2010–2011): 34
Testing
Proficient or Higher ENGLISH LANGUAGE ARTS (ELA) 2011: 85%
Proficient or Higher MATH 2011: 82%
Proficient or Higher SCIENCE 2011: 75%
Average Total SAT Score: 1416
2014 performance at a glance
Student to Teacher Ratio (2010–2011):
4-Year Graduation Rates (2010): 92.6%
Spending per Student (2009–2010, by District): $12,233
Prev
Next
#7 Tantasqua Regional Sr. High
Fiskdale, MA
2014 Overall MA Rank: #63
Enrollment (2010–2011): 756
Testing
Proficient or Higher ENGLISH LANGUAGE ARTS (ELA) 2011: 97%
Proficient or Higher MATH 2011: 86%
Proficient or Higher SCIENCE 2011: 75%
Average Total SAT Score: 1607
2014 performance at a glance
Student to Teacher Ratio (2010–2011): 9.7
4-Year Graduation Rates (2010): 94.9%
Spending per Student (2009–2010, by District): $12,985

Prev
Next
#6 Groton Dunstable Regional
Groton, MA
2014 Overall MA Rank: #62
Enrollment (2010–2011): 870
Testing
Proficient or Higher ENGLISH LANGUAGE ARTS (ELA) 2011: 99%
Proficient or Higher MATH 2011: 98%
Proficient or Higher SCIENCE 2011: 95%
Average Total SAT Score: 1664
2014 performance at a glance
Student to Teacher Ratio (2010–2011): 14.6
4-Year Graduation Rates (2010): 97%
Spending per Student (2009–2010, by District): $12,261

Prev
Next
#5 Hopkinton High
Hopkinton, MA
2014 Overall MA Rank: #53
Enrollment (2010–2011): 1150
Testing
Proficient or Higher ENGLISH LANGUAGE ARTS (ELA) 2011: 98%
Proficient or Higher MATH 2011: 95%
Proficient or Higher SCIENCE 2011: 93%
Average Total SAT Score: 1688
2014 performance at a glance
Student to Teacher Ratio (2010–2011): 14.5
4-Year Graduation Rates (2010): 99.2%
Spending per Student (2009–2010, by District): $12,472

Prev
Next
#4 Algonquin Regional High
Northborough, MA
2014 Overall MA Rank: #33
Enrollment (2010–2011): 1471
Testing
Proficient or Higher ENGLISH LANGUAGE ARTS (ELA) 2011: 99%
Proficient or Higher MATH 2011: 95%
Proficient or Higher SCIENCE 2011: 96%
Average Total SAT Score: 1715
2014 performance at a glance
Student to Teacher Ratio (2010–2011): 14.3
4-Year Graduation Rates (2010): 97.5%
Spending per Student (2009–2010, by District): $13,900
Prev
Next
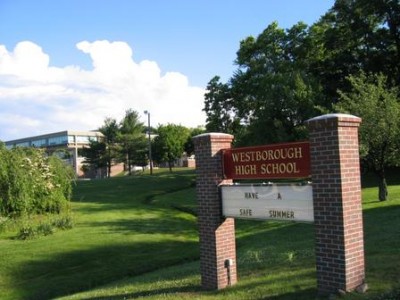
#3 Westborough High
Westborough, MA
2014 Overall MA Rank: #26
Enrollment (2010–2011): 1053
Testing
Proficient or Higher ENGLISH LANGUAGE ARTS (ELA) 2011: 97%
Proficient or Higher MATH 2011: 93%
Proficient or Higher SCIENCE 2011: 95%
Average Total SAT Score: 1716
2014 performance at a glance
Student to Teacher Ratio (2010–2011): 12.6
4-Year Graduation Rates (2010): 96.6%
Spending per Student (2009–2010, by District): $14,545
Prev
Next
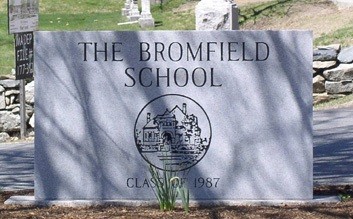
#2 Bromfield
Harvard, MA
2014 Overall MA Rank: #13
Enrollment (2010–2011): 709
Testing
Proficient or Higher ENGLISH LANGUAGE ARTS (ELA) 2011: 100%
Proficient or Higher MATH 2011: 97%
Proficient or Higher SCIENCE 2011: 97%
Average Total SAT Score: 1824
2014 performance at a glance
Student to Teacher Ratio (2010–2011): 13.8
4-Year Graduation Rates (2010): 98.3%
Spending per Student (2009–2010, by District): $13,984

Prev
Next
#1 Advanced Math and Science Academy
Marlborough, MA
2014 Overall MA Rank: #6
Enrollment (2010–2011): 567
Testing
Proficient or Higher ENGLISH LANGUAGE ARTS (ELA) 2011: 100%
Proficient or Higher MATH 2011: 100%
Proficient or Higher SCIENCE 2011: 98%
Average Total SAT Score: 1825
2014 performance at a glance
Student to Teacher Ratio (2010–2011): 11.5
4-Year Graduation Rates (2010): 98.6%
Spending per Student (2009–2010, by District): $14,198
Related Articles
Enjoy this post? Share it with others.
Email to a friend
Permalink


 Delivered Free Every
Follow us on Pinterest Google + Facebook Twitter See It Read It