Poor English Skills Holding Back Immigrants in Worcester


 Email to a friend
Permalink
Email to a friend
Permalink
Thursday, September 25, 2014
Nicholas Handy, GoLocalWorcester Contributor
Immigrants and immigrant families in Worcester and throughout the United States are continuing to be held back by language barriers, destroying opportunities for them to grow and succeed in modern culture.
According to a new study released by the Brooking Institution, 8.4-percent of the current United States adult population lack the current language skills to get a good-paying job.
“National, state, and regional leaders can enhance both the human capital and economic mobility of their current and future workforce by investing in English instruction,” said Jill H. Wilson, senior research analyst and associate fellow, and author of the report. “As the nation discusses how to build a skilled workforce, a focus on enabling immigrants to become more productive members of society will help everyone in the long run.”
According to the report, there are 36,962 Limited English Proficient (LEP) adults living in Worcester as of 2012, representing a 31.6-percent increase from 2000. Over 80-percent of these LEP adults have not graduated college and 24.6-percent have not completed high school.
Results
Key findings of the study show that immigrants and their families are at a clear disadvantage.
Nearly one in ten US working aged adults are currently considered LEP. LEP adults earn 25 to 40-percent less than their English-speaking counterparts and most of the LEP working adults are working in the labor force.
“Given the large number of LEP workers in the United States and the fact that virtually all of the growth in the U.S. labor force over the next four decades is projected to come from immigrants and their children, it is in our collective interest to tackle this challenge head on,” says Wilson.
Worcester Impact
One of the largest problems facing Worcester is the lack of English learning opportunities throughout the city, coupled with the lack of diversity in teachers, community leaders, etc.
According to Mary Jo Marion, Executive Director of the Latino Education Institute in Worcester, many of the immigrants coming to Worcester attempt to learn the language, but are faced with challenges because there are not enough free programs in the city to provide proper language education to the people that need it. Additionally, families often struggle to integrate into schools and the community because of these language barriers; there are simply not enough dual language teachers in staff members throughout the city to ease communication, something that often leads to struggles integrating into society and getting a proper education.
“We have a free ESL classes that we provide to residents of Worcester, but we can only take 300 at a time,” said Marion. “One of the largest issues in Worcester is not having anywhere for immigrants to learn the language. Immigrants are also a group that typically gets marginalized; many of them work together in the same industries and suffer from the same problems.”
Related Slideshow: The 50 Least Diverse High Schools in Massachusetts
Prev
Next
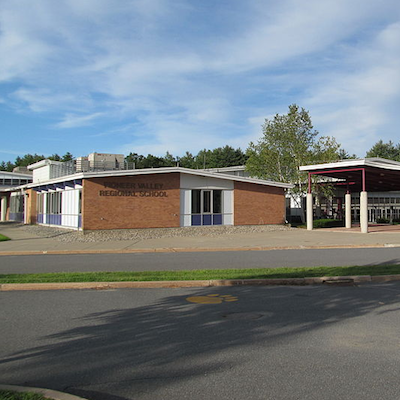
#50 Pioneer Valley Reg.
Northfield, MA
Total enrollment: 500
Percentage of total enrollment
Amer Indian/Alaskan: 0.9%
Asian/Pacific Islander: 1.6%
Black: 1.0%
Hispanic: 2.4%
Two or more races: 1.0%
White: 93.2%

Prev
Next
#49 Health & Human Svc.
Health & Human Svc. HS, Lawrence, MA
Total enrollment: 520
Percentage of total enrollment
Amer Indian/Alaskan: 0.0%
Asian/Pacific Islander: 0.6%
Black: 2.5%
Hispanic: 93.3%
Two or more races: 0.2%
White: 3.5%

Prev
Next
#48 South Shore HS
South Shore Voc. Tech. HS, Hanover, MA
Total enrollment: 600
Percentage of total enrollment
Amer Indian/Alaskan: 0.0%
Asian/Pacific Islander: 0.0%
Black: 2.8%
Hispanic: 2.7%
Two or more races: 1.2%
White: 93.3%

Prev
Next
#47 Seekonk HS
Seekonk, MA
Total enrollment: 628
Percentage of total enrollment
Amer Indian/Alaskan: 0.0%
Asian/Pacific Islander: 2.7%
Black: 0.8%
Hispanic: 2.4%
Two or more races: 0.8%
White: 93.3%

Prev
Next
#46 Athol HS
Athol, MA
Total enrollment: 378
Percentage of total enrollment
Amer Indian/Alaskan: 0.0%
Asian/Pacific Islander: 0.0%
Black: 1.9%
Hispanic: 2.9%
Two or more races: 1.9%
White: 93.4%

Prev
Next
#45 Humanities & Leadership
Humanities & Leadership Dev. HS, Lawrence, MA
Total enrollment: 521
Percentage of total enrollment
Amer Indian/Alaskan: 0.0%
Asian/Pacific Islander: 1.7%
Black: 1.9%
Hispanic: 93.5%
Two or more races: 0.0%
White: 2.9%

Prev
Next
#44 Blackstone Valley
Blackstone Valley Reg. Voc. Tech., Upton, MA
Total enrollment: 1,164
Percentage of total enrollment
Amer Indian/Alaskan: 0.0%
Asian/Pacific Islander: 0.8%
Black: 0.8%
Hispanic: 2.8%
Two or more races: 2.1%
White: 93.5%

Prev
Next
#43 Hopedale Jr. Sr. HS
Hopedale, MA
Total enrollment: 548
Percentage of total enrollment
Amer Indian/Alaskan: 0.5%
Asian/Pacific Islander: 1.6%
Black: 0.5%
Hispanic: 2.6%
Two or more races: 1.1%
White: 93.6%

Prev
Next
#42 Wahconah Reg. HS
Dalton, MA
Total enrollment: 563
Percentage of total enrollment
Amer Indian/Alaskan: 0.0%
Asian/Pacific Islander: 0.7%
Black: 0.9%
Hispanic: 2.0%
Two or more races: 2.7%
White: 93.8%

Prev
Next
#41 W. Wareham Academy
Wareham, MA
Total enrollment: 16
Percentage of total enrollment
Amer Indian/Alaskan: 0.0%
Asian/Pacific Islander: 0.0%
Black: 0.0%
Hispanic: 0.0%
Two or more races: 6.2%
White: 93.8%

Prev
Next
#40 Sutton HS
Sutton, MA
Total enrollment: 418
Percentage of total enrollment
Amer Indian/Alaskan: 0.0%
Asian/Pacific Islander: 0.2%
Black: 0.5%
Hispanic: 1.7%
Two or more races: 3.8%
White: 93.8%

Prev
Next
#39 Bay Path HS
Bay Path Reg. Voc. Tech. HS, Charlton, MA
Total enrollment: 1,104
Percentage of total enrollment
Amer Indian/Alaskan: 0.1%
Asian/Pacific Islander: 0.5%
Black: 0.4%
Hispanic: 4.9%
Two or more races: 0.3%
White: 93.9%

Prev
Next
#38 HS Learning Center
Lawrence, MA
Total enrollment: 167
Percentage of total enrollment
Amer Indian/Alaskan: 0.0%
Asian/Pacific Islander: 1.8%
Black: 1.8%
Hispanic: 94.0%
Two or more races: 0.0%
White: 2.4%

Prev
Next
#37 Shawsheen Valley
Shawsheen Valley Vocational Tech., Billerica, MA
Total enrollment: 1,372
Percentage of total enrollment
Amer Indian/Alaskan: 0.2%
Asian/Pacific Islander: 0.4%
Black: 0.8%
Hispanic: 3.0%
Two or more races: 1.5%
White: 94.1%

Prev
Next
#36 Nipmuc Reg. HS
Upton, MA
Total enrollment: 667
Percentage of total enrollment
Amer Indian/Alaskan: 0.1%
Asian/Pacific Islander: 1.4%
Black: 1.2%
Hispanic: 2.4%
Two or more races: 0.7%
White: 94.0%

Prev
Next
#35 Tewksbury Memorial HS
Tewksbury, MA
Total enrollment: 985
Percentage of total enrollment
Amer Indian/Alaskan: 0.1%
Asian/Pacific Islander: 2.6%
Black: 1.3%
Hispanic: 1.8%
Two or more races: 0.0%
White: 94.1%

Prev
Next
#34 N. Reading HS
North Reading, MA
Total enrollment: 755
Percentage of total enrollment
Amer Indian/Alaskan: 0.0%
Asian/Pacific Islander: 1.9%
Black: 0.5%
Hispanic: 2.0%
Two or more races: 1.5%
White: 94.2%

Prev
Next
#33 Joseph Case HS
Swansea, MA
Total enrollment: 551
Percentage of total enrollment
Amer Indian/Alaskan: 0.2%
Asian/Pacific Islander: 0.9%
Black: 2.0%
Hispanic: 0.9%
Two or more races: 1.6%
White: 94.4%

Prev
Next
#32 Gardner Academy
Gardner Academy for Learning and Tech., Gardner, MA
Total enrollment: 91
Percentage of total enrollment
Amer Indian/Alaskan: 0.0%
Asian/Pacific Islander: 1.1%
Black: 0.0%
Hispanic: 2.2%
Two or more races: 2.2%
White: 94.5%
Prev
Next
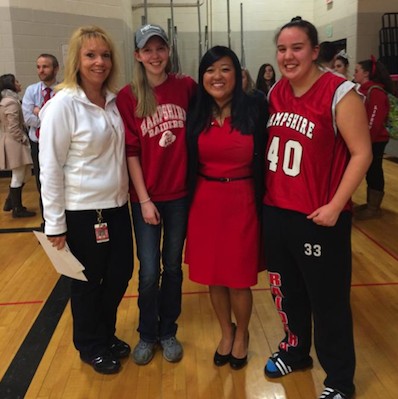
#31 Hampshire Reg. HS
Westhampton, MA
Total enrollment: 756
Percentage of total enrollment
Amer Indian/Alaskan: 0.0%
Asian/Pacific Islander: 0.4%
Black: 0.5%
Hispanic: 2.8%
Two or more races: 1.6%
White: 94.7%

Prev
Next
#30 Triton Reg. HS
Byfield, MA
Total enrollment: 738
Percentage of total enrollment
Amer Indian/Alaskan: 0.0%
Asian/Pacific Islander: 1.2%
Black: 0.5%
Hispanic: 2.7%
Two or more races: 0.8%
White: 94.7%

Prev
Next
#29 Medway HS
Medway, MA
Total enrollment: 779
Percentage of total enrollment
Amer Indian/Alaskan: 0.3%
Asian/Pacific Islander: 1.9%
Black: 0.5%
Hispanic: 1.9%
Two or more races: 0.6%
White: 94.7%

Prev
Next
#28 Apponequet Reg. HS
Lakeville, MA
Total enrollment: 813
Percentage of total enrollment
Amer Indian/Alaskan: 0.2%
Asian/Pacific Islander: 1.1%
Black: 0.6%
Hispanic: 1.5%
Two or more races: 1.8%
White: 94.7%

Prev
Next
#27 Pentucket HS
Pentucket Regional Sen. HS, West Newbury, MA
Total enrollment: 785
Percentage of total enrollment
Amer Indian/Alaskan: 0.0%
Asian/Pacific Islander: 1.4%
Black: 0.4%
Hispanic: 1.9%
Two or more races: 1.5%
White: 94.8%

Prev
Next
#26 Gateway Reg. HS
Huntington, MA
Total enrollment: 282
Percentage of total enrollment
Amer Indian/Alaskan: 0.0%
Asian/Pacific Islander: 0.7%
Black: 0.4%
Hispanic: 2.8%
Two or more races: 1.1%
White: 95.0%

Prev
Next
#25 N. Middlesex Reg. HS
Townsend, MA
Total enrollment: 956
Percentage of total enrollment
Amer Indian/Alaskan: 0.1%
Asian/Pacific Islander: 1.5%
Black: 0.8%
Hispanic: 1.7%
Two or more races: 0.8%
White: 95.1%

Prev
Next
#24 Scituate HS
Scituate, MA
Total enrollment: 947
Percentage of total enrollment
Amer Indian/Alaskan: 0.0%
Asian/Pacific Islander: 0.9%
Black: 2.2%
Hispanic: 0.4%
Two or more races: 1.3%
White: 95.1%
Prev
Next
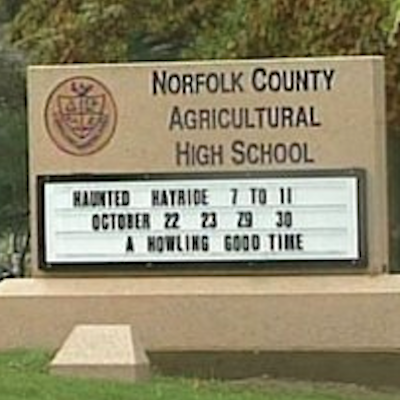
#23 Norfolk County HS
Norfolk County Agricultural HS, Walpole, MA
Total enrollment: 476
Percentage of total enrollment
Amer Indian/Alaskan: 0.0%
Asian/Pacific Islander: 1.1%
Black: 1.1%
Hispanic: 1.5%
Two or more races: 1.1%
White: 95.4%

Prev
Next
#22 Masconomet Reg. HS
Topsfield, MA
Total enrollment: 1,382
Percentage of total enrollment
Amer Indian/Alaskan: 0.1%
Asian/Pacific Islander: 2.2%
Black: 0.4%
Hispanic: 1.7%
Two or more races: 0.1%
White: 95.4%
Prev
Next
#21 King Phillip Reg. HS
Wrentham, MA
Total enrollment: 1,322
Percentage of total enrollment
Amer Indian/Alaskan: 0.3%
Asian/Pacific Islander: 1.1%
Black: 0.8%
Hispanic: 0.7%
Two or more races: 1.4%
White: 95.8%

Prev
Next
#20 Norwell HS
Norwell, MA
Total enrollment: 677
Percentage of total enrollment
Amer Indian/Alaskan: 1.2%
Asian/Pacific Islander: 0.4%
Black: 0.1%
Hispanic: 2.1%
Two or more races: 0.6%
White: 96.0%

Prev
Next
#19 Norton HS
Norton, MA
Total enrollment: 715
Percentage of total enrollment
Amer Indian/Alaskan: 0.0%
Asian/Pacific Islander: 1.6%
Black: 1.1%
Hispanic: 0.8%
Two or more races: 0.3%
White: 95.4%

Prev
Next
#18 Charles McCann
Charles McCann Voc. Tech., North Adams, MA
Total enrollment: 505
Percentage of total enrollment
Amer Indian/Alaskan: 0.0%
Asian/Pacific Islander: 0.4%
Black: 1.0%
Hispanic: 2.0%
Two or more races: 0.8%
White: 95.8%
Prev
Next
#17 Westfield Vocational
Westfield Vocational Tech. HS, Westfield, MA
Total enrollment: 470
Percentage of total enrollment
Amer Indian/Alaskan: 0.0%
Asian/Pacific Islander: 1.5%
Black: 1.5%
Hispanic: 0.6%
Two or more races: 0.4%
White: 96.0%

Prev
Next
#16 Medfield Senior High
Medfield, MA
Total enrollment: 882
Percentage of total enrollment
Amer Indian/Alaskan: 0.0%
Asian/Pacific Islander: 3.3%
Black: 0.3%
Hispanic: 1.6%
Two or more races: 1.5%
White: 93.3%

Prev
Next
#15 Georgetown MS/HS
Georgetown, MA
Total enrollment: 407
Percentage of total enrollment
Amer Indian/Alaskan: 0.0%
Asian/Pacific Islander: 1.0%
Black: 0.0%
Hispanic: 1.2%
Two or more races: 1.5%
White: 96.3%

Prev
Next
#14 Hanover HS
Hanover, MA
Total enrollment: 778
Percentage of total enrollment
Amer Indian/Alaskan: 0.0%
Asian/Pacific Islander: 1.2%
Black: 1.2%
Hispanic: 1.0%
Two or more races: 0.3%
White: 96.4%

Prev
Next
#13 Carver MS/HS
Carver, MA
Total enrollment: 870
Percentage of total enrollment
Amer Indian/Alaskan: 0.2%
Asian/Pacific Islander: 0.1%
Black: 2.3%
Hispanic: 0.3%
Two or more races: 0.7%
White: 96.3%

Prev
Next
#12 Duxbury HS
Duxbury, MA
Total enrollment: 1,037
Percentage of total enrollment
Amer Indian/Alaskan: 0.2%
Asian/Pacific Islander: 1.1%
Black: 0.3%
Hispanic: 0.8%
Two or more races: 1.2%
White: 96.5%

Prev
Next
#11 Westport HS
Westport, MA
Total enrollment: 381
Percentage of total enrollment
Amer Indian/Alaskan: 0.0%
Asian/Pacific Islander: 0.3%
Black: 0.5%
Hispanic: 2.4%
Two or more races: 0.0%
White: 96.9%

Prev
Next
#10 Pembroke HS
Pembroke, MA
Total enrollment: 984
Percentage of total enrollment
Amer Indian/Alaskan: 0.0%
Asian/Pacific Islander: 0.8%
Black: 1.2%
Hispanic: 1.0%
Two or more races: 0.1%
White: 96.8%

Prev
Next
#9 Marshfield HS
Marshfield, MA
Total enrollment: 1,304
Percentage of total enrollment
Amer Indian/Alaskan: 0.1%
Asian/Pacific Islander: 0.6%
Black: 0.2%
Hispanic: 1.8%
Two or more races: 0.5%
White: 96.9%

Prev
Next
#8 Franklin County Tech.
Turners Falls, MA
Total enrollment: 523
Percentage of total enrollment
Amer Indian/Alaskan: 0.2%
Asian/Pacific Islander: 0.6%
Black: 0.0%
Hispanic: 1.0%
Two or more races: 1.3%
White: 96.9%

Prev
Next
#7 Sandwich HS
Sandwich, MA
Total enrollment: 786
Percentage of total enrollment
Amer Indian/Alaskan: 0.1%
Asian/Pacific Islander: 1.8%
Black: 1.1%
Hispanic: 0.0%
Two or more races: 0.0%
White: 96.9%
Prev
Next
#6 Silver Lake Reg. HS
Kingston, MA
Total enrollment: 1,274
Percentage of total enrollment
Amer Indian/Alaskan: 0.1%
Asian/Pacific Islander: 0.7%
Black: 1.5%
Hispanic: 0.2%
Two or more races: 0.2%
White: 97.4%

Prev
Next
#5 Douglas HS
Douglas, MA
Total enrollment: 573
Percentage of total enrollment
Amer Indian/Alaskan: 0.0%
Asian/Pacific Islander: 0.5%
Black: 0.0%
Hispanic: 1.6%
Two or more races: 0.5%
White: 97.4%
Prev
Next
#4 Old Colony Vocational
Old Colony Reg. Vocational Tech., Rochester, MA
Total enrollment: 579
Percentage of total enrollment
Amer Indian/Alaskan: 0.0%
Asian/Pacific Islander: 0.0%
Black: 0.3%
Hispanic: 0.5%
Two or more races: 1.0%
White: 98.1%

Prev
Next
#3 International HS
Lawrence, MA
Total enrollment: 521
Percentage of total enrollment
Amer Indian/Alaskan: 0.0%
Asian/Pacific Islander: 0.6%
Black: 0.2%
Hispanic: 98.5%
Two or more races: 0.0%
White: 0.8%
Prev
Next
#2 Tahanto Regional HS
Boylston, MA
Total enrollment: 542
Percentage of total enrollment
Amer Indian/Alaskan: 0.0%
Asian/Pacific Islander: 0.2%
Black: 0.6%
Hispanic: 0.0%
Two or more races: 0.2%
White: 99.1%

Prev
Next
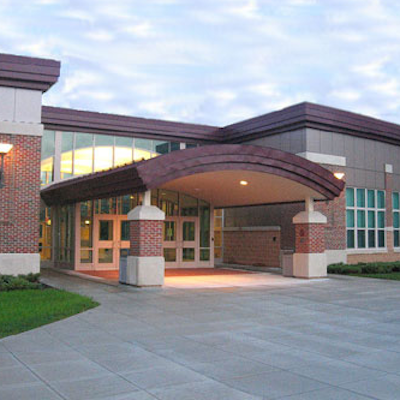
#1 Manchester Essex HS
Manchester Essex Regional HS, Manchester, MA
Total enrollment: 461
Percentage of total enrollment
Amer Indian/Alaskan: 0.0%
Asian/Pacific Islander: 0.0%
Black: 0.4%
Hispanic: 0.0%
Two or more races: 0.2%
White: 99.3%
Related Articles
Enjoy this post? Share it with others.
Email to a friend
Permalink


 Delivered Free Every
Follow us on Pinterest Google + Facebook Twitter See It Read It