Science Says Central MA School Days Starting Too Early for Teens


 Email to a friend
Permalink
Email to a friend
Permalink
Saturday, August 30, 2014
Nicholas Handy, GoLocalWorcester Contributor
A recent policy statement by the American Academy of Pediatrics is recommending that all middle and high schools should reevaluate school start times, pushing them back to 8:30 am or later.
Research shows that adolescent students are not getting enough sleep because biological sleep rhythms are altered when one enters puberty, making it harder for teenagers to fall asleep early enough to get the recommended amount of sleep.
“The research is clear that adolescents who get enough sleep have a reduced risk of being overweight or suffering depression, are less likely to be involved in automobile accidents, and have better grades, higher standardized test scores and an overall better quality of life,” said pediatrician Judith Owens, MD, FAAP, lead author of the policy statement, “School Start Times for Adolescents,” published in the September 2014 issue of Pediatrics. “Studies have shown that delaying early school start times is one key factor that can help adolescents get the sleep they need to grow and learn.”
While the data has been around for at least a decade now, the recent policy recommendations is leading many school districts and statewide organizations throughout Massachusetts to examine the potential benefits and concerns to implementing later school start times for teenagers.
Challenges of Implementing
While the research points toward making start times in school later for adolescents, it is not a proclamation that is without its challenges.
Moving back school times requires a lot of moving parts to change and fit together in a different way. Transportation schedules, after school activities, and daycare arrangements (many teenagers care for younger siblings when they get out of school) are all things that would be affected by altering a school schedule.
“Logistically, moving school start times presents a lot of challenges that people have been wrestling with,” said Glenn Koocher, the Executive Director of the Massachusetts Association of School Committees. “This is a change that would thoroughly disrupt everyone involved with day-to-day operations of schools. There would be a lot of steps and a lot of people that would have to be involved to make something like this work. My gut tells me that for everyone out there that would be satisfied with the change, there would be someone who was opposed.”
Putting Education First
The Worcester School Committee has been working to implement earlier start times in Worcester school districts as early as 2002, when school committee member Brian O’Connell had brought the idea up.
O’Connell says that the evidence is out there pointing to the wealth of benefits that later start times would have for both middle and high school students. There may be challenges in implementing the later start times – it is certainly a process that is at least a year in the making – but O’Connell feels the discussion needs to happen because the education of students should be the highest priority.
“If our focus is on the issues of implementing later start times and not the benefits that that it would have for students, then we are not looking out for the best interests of the future of our children,” said O’Connell. “We have enough evidence saying that this would be a beneficial change for our students. I think that this is a topic that needs a little urgency.”
In addition to O’Connell calling for a closer look at changing the start times, fellow Worcester School Committee member Tracy Novick also wants the district to take a closer look. Novick has brought the topic up to each of school committee’s subcommittees in hopes that the continued discussion can help create change.
“We need to always be having this conversation; ignoring research seems to be irresponsible,” said Novick. “I think that this is a topic that a lot of people want to have a conversation about. Anytime you teach against the grain, you are going to create a lot of unnecessary problems.”
Related Slideshow: Central MA High Schools—2014 Rankings
Add link to methodology post.
Prev
Next
#59 Tantasqua Regional Vocational
Fiskdale, MA
2014 Overall MA Rank: #328
Enrollment (2010–2011): 460
Testing
Proficient or Higher ENGLISH LANGUAGE ARTS (ELA) 2011: 93%
Proficient or Higher MATH 2011: 72%
Proficient or Higher SCIENCE 2011: 54%
Average Total SAT Score: 1453
2014 performance at a glance
Student to Teacher Ratio (2010–2011): 38.1
4-Year Graduation Rates (2010): 89.3%
Spending per Student (2009–2010, by District): $12,985

Prev
Next
#58 North High
Worcester, MA
2014 Overall MA Rank: #321
Enrollment (2010–2011): 1295
Testing
Proficient or Higher ENGLISH LANGUAGE ARTS (ELA) 2011: 71%
Proficient or Higher MATH 2011: 48%
Proficient or Higher SCIENCE 2011: 34%
Average Total SAT Score: 1272
2014 performance at a glance
Student to Teacher Ratio (2010–2011): 17.9
4-Year Graduation Rates (2010): 65.2%
Spending per Student (2009–2010, by District): $13,489

Prev
Next
#57 Southbridge High
Southbridge, MA
2014 Overall MA Rank: #315
Enrollment (2010–2011): 472
Testing
Proficient or Higher ENGLISH LANGUAGE ARTS (ELA) 2011: 73%
Proficient or Higher MATH 2011: 46%
Proficient or Higher SCIENCE 2011: 45%
Average Total SAT Score: 1179
2014 performance at a glance
Student to Teacher Ratio (2010–2011): 13.8
4-Year Graduation Rates (2010): 84.4%
Spending per Student (2009–2010, by District): $12,894

Prev
Next
#56 Claremont Academy
Worcester, MA
2014 Overall MA Rank: #309
Enrollment (2010–2011): 267
Testing
Proficient or Higher ENGLISH LANGUAGE ARTS (ELA) 2011: 73%
Proficient or Higher MATH 2011: 45%
Proficient or Higher SCIENCE 2011: 27%
Average Total SAT Score: 1258
2014 performance at a glance
Student to Teacher Ratio (2010–2011): 12
4-Year Graduation Rates (2010): 72.5%
Spending per Student (2009–2010, by District): $13,489

Prev
Next
#55 South High Community
Worcester, MA
2014 Overall MA Rank: #306
Enrollment (2010–2011): 1264
Testing
Proficient or Higher ENGLISH LANGUAGE ARTS (ELA) 2011: 78%
Proficient or Higher MATH 2011: 56%
Proficient or Higher SCIENCE 2011: 44%
Average Total SAT Score: 1309
2014 performance at a glance
Student to Teacher Ratio (2010–2011): 15.2
4-Year Graduation Rates (2010): 64.7%
Spending per Student (2009–2010, by District): $13,489

Prev
Next
#54 Fitchburg High
Fitchburg, MA
2014 Overall MA Rank: #299
Enrollment (2010–2011): 1116
Testing
Proficient or Higher ENGLISH LANGUAGE ARTS (ELA) 2011: 83%
Proficient or Higher MATH 2011: 66%
Proficient or Higher SCIENCE 2011: 46%
Average Total SAT Score: 1294
2014 performance at a glance
Student to Teacher Ratio (2010–2011): 14.5
4-Year Graduation Rates (2010): 82.8%
Spending per Student (2009–2010, by District): $12,681

Prev
Next
#53 Burncoat Senior High
Worcester, MA
2014 Overall MA Rank: #295
Enrollment (2010–2011): 996
Testing
Proficient or Higher ENGLISH LANGUAGE ARTS (ELA) 2011: 78%
Proficient or Higher MATH 2011: 61%
Proficient or Higher SCIENCE 2011: 38%
Average Total SAT Score: 1340
2014 performance at a glance
Student to Teacher Ratio (2010–2011): 12.6
4-Year Graduation Rates (2010): 72.2%
Spending per Student (2009–2010, by District): $13,489

Prev
Next
#52 Ware Junior/Senior High School
Ware, MA
2014 Overall MA Rank: #277
Enrollment (2010–2011): 280
Testing
Proficient or Higher ENGLISH LANGUAGE ARTS (ELA) 2011: 86%
Proficient or Higher MATH 2011: 71%
Proficient or Higher SCIENCE 2011: 63%
Average Total SAT Score: 1429
2014 performance at a glance
Student to Teacher Ratio (2010–2011): 13.2
4-Year Graduation Rates (2010): 76.5%
Spending per Student (2009–2010, by District): $11,919

Prev
Next
#51 Doherty Memorial High
Worcester, MA
2014 Overall MA Rank: #275
Enrollment (2010–2011): 1337
Testing
Proficient or Higher ENGLISH LANGUAGE ARTS (ELA) 2011: 86%
Proficient or Higher MATH 2011: 71%
Proficient or Higher SCIENCE 2011: 62%
Average Total SAT Score: 1417
2014 performance at a glance
Student to Teacher Ratio (2010–2011): 14.8
4-Year Graduation Rates (2010): 83.2%
Spending per Student (2009–2010, by District): $13,489

Prev
Next
#50 Worcester Technical High
Worcester, MA
2014 Overall MA Rank: #271
Enrollment (2010–2011): 1358
Testing
Proficient or Higher ENGLISH LANGUAGE ARTS (ELA) 2011: 92%
Proficient or Higher MATH 2011: 84%
Proficient or Higher SCIENCE 2011: 59%
Average Total SAT Score: 1249
2014 performance at a glance
Student to Teacher Ratio (2010–2011): 11.8
4-Year Graduation Rates (2010): 95%
Spending per Student (2009–2010, by District): $13,489

Prev
Next
#49 Bartlett Jr Sr High School
Webster, MA
2014 Overall MA Rank: #270
Enrollment (2010–2011): 472
Testing
Proficient or Higher ENGLISH LANGUAGE ARTS (ELA) 2011: 93%
Proficient or Higher MATH 2011: 81%
Proficient or Higher SCIENCE 2011: 55%
Average Total SAT Score: 1387
2014 performance at a glance
Student to Teacher Ratio (2010–2011): 12.5
4-Year Graduation Rates (2010): 70%
Spending per Student (2009–2010, by District): $12,786

Prev
Next
#48 Murdock Middle/High
Winchendon, MA
2014 Overall MA Rank: #265
Enrollment (2010–2011): 325
Testing
Proficient or Higher ENGLISH LANGUAGE ARTS (ELA) 2011: 80%
Proficient or Higher MATH 2011: 60%
Proficient or Higher SCIENCE 2011: 52%
Average Total SAT Score: 1483
2014 performance at a glance
Student to Teacher Ratio (2010–2011): 11.7
4-Year Graduation Rates (2010): 91%
Spending per Student (2009–2010, by District): $12,737

Prev
Next
#47 David Prouty High
Spencer, MA
2014 Overall MA Rank: #262
Enrollment (2010–2011): 473
Testing
Proficient or Higher ENGLISH LANGUAGE ARTS (ELA) 2011: 90%
Proficient or Higher MATH 2011: 82%
Proficient or Higher SCIENCE 2011: 54%
Average Total SAT Score: 1468
2014 performance at a glance
Student to Teacher Ratio (2010–2011): 14.5
4-Year Graduation Rates (2010): 87.7%
Spending per Student (2009–2010, by District): $12,290

Prev
Next
#46 Athol-Royalston High
Athol, MA
2014 Overall MA Rank: #254
Enrollment (2010–2011): 378
Testing
Proficient or Higher ENGLISH LANGUAGE ARTS (ELA) 2011: 90%
Proficient or Higher MATH 2011: 72%
Proficient or Higher SCIENCE 2011: 76%
Average Total SAT Score: 1364
2014 performance at a glance
Student to Teacher Ratio (2010–2011): 11.9
4-Year Graduation Rates (2010): 81.9%
Spending per Student (2009–2010, by District): $13,679
Prev
Next
#45 Leominster Senior High
Leominster, MA
2014 Overall MA Rank: #253
Enrollment (2010–2011): 1105
Testing
Proficient or Higher ENGLISH LANGUAGE ARTS (ELA) 2011: 91%
Proficient or Higher MATH 2011: 74%
Proficient or Higher SCIENCE 2011: 82%
Average Total SAT Score: 1472
2014 performance at a glance
Student to Teacher Ratio (2010–2011): 15.6
4-Year Graduation Rates (2010): 90.4%
Spending per Student (2009–2010, by District): $12,233

Prev
Next
#44 University Pk Campus School
Worcester, MA
2014 Overall MA Rank: #249
Enrollment (2010–2011): 148
Testing
Proficient or Higher ENGLISH LANGUAGE ARTS (ELA) 2011: 94%
Proficient or Higher MATH 2011: 74%
Proficient or Higher SCIENCE 2011: 62%
Average Total SAT Score: 1384
2014 performance at a glance
Student to Teacher Ratio (2010–2011): 13.3
4-Year Graduation Rates (2010): 100%
Spending per Student (2009–2010, by District): $13,489

Prev
Next
#43 Clinton Senior High
Clinton, MA
2014 Overall MA Rank: #246
Enrollment (2010–2011): 466
Testing
Proficient or Higher ENGLISH LANGUAGE ARTS (ELA) 2011: 95%
Proficient or Higher MATH 2011: 79%
Proficient or Higher SCIENCE 2011: 65%
Average Total SAT Score: 1473
2014 performance at a glance
Student to Teacher Ratio (2010–2011): 13.6
4-Year Graduation Rates (2010): 89.1%
Spending per Student (2009–2010, by District): $11,273

Prev
Next
#42 Oxford High
Oxford, MA
2014 Overall MA Rank: #241
Enrollment (2010–2011): 450
Testing
Proficient or Higher ENGLISH LANGUAGE ARTS (ELA) 2011: 84%
Proficient or Higher MATH 2011: 69%
Proficient or Higher SCIENCE 2011: 67%
Average Total SAT Score: 1504
2014 performance at a glance
Student to Teacher Ratio (2010–2011): 11.5
4-Year Graduation Rates (2010): 80.6%
Spending per Student (2009–2010, by District): $11,955

Prev
Next
#41 Uxbridge High
Uxbridge, MA
2014 Overall MA Rank: #234
Enrollment (2010–2011): 478
Testing
Proficient or Higher ENGLISH LANGUAGE ARTS (ELA) 2011: 87%
Proficient or Higher MATH 2011: 76%
Proficient or Higher SCIENCE 2011: 77%
Average Total SAT Score: 1548
2014 performance at a glance
Student to Teacher Ratio (2010–2011): 15.8
4-Year Graduation Rates (2010): 89.2%
Spending per Student (2009–2010, by District): $12,074

Prev
Next
#40 Northbridge High
Whitinsville, MA
2014 Overall MA Rank: #222
Enrollment (2010–2011): 677
Testing
Proficient or Higher ENGLISH LANGUAGE ARTS (ELA) 2011: 92%
Proficient or Higher MATH 2011: 74%
Proficient or Higher SCIENCE 2011: 75%
Average Total SAT Score: 1525
2014 performance at a glance
Student to Teacher Ratio (2010–2011): 12.6
4-Year Graduation Rates (2010): 84.2%
Spending per Student (2009–2010, by District): $11,129

Prev
Next
#39 Douglas High School
Douglas, MA
2014 Overall MA Rank: #220
Enrollment (2010–2011): 573
Testing
Proficient or Higher ENGLISH LANGUAGE ARTS (ELA) 2011: 93%
Proficient or Higher MATH 2011: 81%
Proficient or Higher SCIENCE 2011: 78%
Average Total SAT Score: 1538
2014 performance at a glance
Student to Teacher Ratio (2010–2011): 13.1
4-Year Graduation Rates (2010): 85.1%
Spending per Student (2009–2010, by District): $10,070

Prev
Next
#38 Shepherd Hill Regional High
Dudley, MA
2014 Overall MA Rank: #219
Enrollment (2010–2011): 1106
Testing
Proficient or Higher ENGLISH LANGUAGE ARTS (ELA) 2011: 93%
Proficient or Higher MATH 2011: 86%
Proficient or Higher SCIENCE 2011: 84%
Average Total SAT Score: 1523
2014 performance at a glance
Student to Teacher Ratio (2010–2011): 15.1
4-Year Graduation Rates (2010): 93.9%
Spending per Student (2009–2010, by District): $10,624

Prev
Next
#37 Milford High
Milford, MA
2014 Overall MA Rank: #216
Enrollment (2010–2011): 1111
Testing
Proficient or Higher ENGLISH LANGUAGE ARTS (ELA) 2011: 92%
Proficient or Higher MATH 2011: 80%
Proficient or Higher SCIENCE 2011: 72%
Average Total SAT Score: 1512
2014 performance at a glance
Student to Teacher Ratio (2010–2011): 13.6
4-Year Graduation Rates (2010): 87.5%
Spending per Student (2009–2010, by District): $12,284

Prev
Next
#36 Abby Kelley Foster Charter
Worcester, MA
2014 Overall MA Rank: #214
Enrollment (2010–2011): 343
Testing
Proficient or Higher ENGLISH LANGUAGE ARTS (ELA) 2011: 100%
Proficient or Higher MATH 2011: 88%
Proficient or Higher SCIENCE 2011: 70%
Average Total SAT Score: 1386
2014 performance at a glance
Student to Teacher Ratio (2010–2011): 12.8
4-Year Graduation Rates (2010): 92%
Spending per Student (2009–2010, by District): $13,489

Prev
Next
#35 Gardner High
Gardner, MA
2014 Overall MA Rank: #201
Enrollment (2010–2011): 563
Testing
Proficient or Higher ENGLISH LANGUAGE ARTS (ELA) 2011: 94%
Proficient or Higher MATH 2011: 80%
Proficient or Higher SCIENCE 2011: 70%
Average Total SAT Score: 1534
2014 performance at a glance
Student to Teacher Ratio (2010–2011): 12.4
4-Year Graduation Rates (2010): 87.4%
Spending per Student (2009–2010, by District): $11,310

Prev
Next
#34 Narragansett Regional High
Baldwinville, MA
2014 Overall MA Rank: #199
Enrollment (2010–2011): 385
Testing
Proficient or Higher ENGLISH LANGUAGE ARTS (ELA) 2011: 97%
Proficient or Higher MATH 2011: 82%
Proficient or Higher SCIENCE 2011: 82%
Average Total SAT Score: 1438
2014 performance at a glance
Student to Teacher Ratio (2010–2011): 11.7
4-Year Graduation Rates (2010): 92.6%
Spending per Student (2009–2010, by District): $11,738

Prev
Next
#33 North Brookfield High
North Brookfield, MA
2014 Overall MA Rank: #198
Enrollment (2010–2011): 223
Testing
Proficient or Higher ENGLISH LANGUAGE ARTS (ELA) 2011: 97%
Proficient or Higher MATH 2011: 77%
Proficient or Higher SCIENCE 2011: 71%
Average Total SAT Score: 1448
2014 performance at a glance
Student to Teacher Ratio (2010–2011): 10.1
4-Year Graduation Rates (2010): 84.6%
Spending per Student (2009–2010, by District): $12,295

Prev
Next
#32 North Central Charter Essential
Fitchburg, MA
2014 Overall MA Rank: #197
Enrollment (2010–2011): 219
Testing
Proficient or Higher ENGLISH LANGUAGE ARTS (ELA) 2011: 95%
Proficient or Higher MATH 2011: 89%
Proficient or Higher SCIENCE 2011: 54%
Average Total SAT Score: 1429
2014 performance at a glance
Student to Teacher Ratio (2010–2011): 9.4
4-Year Graduation Rates (2010): 86.3%
Spending per Student (2009–2010, by District): $12,681

Prev
Next
#31 Montachusett Regional Vocational
Fitchburg, MA
2014 Overall MA Rank: #193
Enrollment (2010–2011): 1433
Testing
Proficient or Higher ENGLISH LANGUAGE ARTS (ELA) 2011: 95%
Proficient or Higher MATH 2011: 80%
Proficient or Higher SCIENCE 2011: 72%
Average Total SAT Score: 1387
2014 performance at a glance
Student to Teacher Ratio (2010–2011): 13.9
4-Year Graduation Rates (2010): 96.6%
Spending per Student (2009–2010, by District): $17,281

Prev
Next
#30 Assabet Valley Vocational High
Marlborough, MA
2014 Overall MA Rank: #183
Enrollment (2010–2011): 1026
Testing
Proficient or Higher ENGLISH LANGUAGE ARTS (ELA) 2011: 93%
Proficient or Higher MATH 2011: 77%
Proficient or Higher SCIENCE 2011: 76%
Average Total SAT Score: 1322
2014 performance at a glance
Student to Teacher Ratio (2010–2011): 10.6
4-Year Graduation Rates (2010): 90.8%
Spending per Student (2009–2010, by District): $17,360

Prev
Next
#29 North Middlesex Regional
Townsend, MA
2014 Overall MA Rank: #182
Enrollment (2010–2011): 956
Testing
Proficient or Higher ENGLISH LANGUAGE ARTS (ELA) 2011: 97%
Proficient or Higher MATH 2011: 87%
Proficient or Higher SCIENCE 2011: 79%
Average Total SAT Score: 1545
2014 performance at a glance
Student to Teacher Ratio (2010–2011): 14.4
4-Year Graduation Rates (2010): 93.7%
Spending per Student (2009–2010, by District): $11,461

Prev
Next
#28 West Boylston Jr Sr High
West Boylston, MA
2014 Overall MA Rank: #178
Enrollment (2010–2011): 278
Testing
Proficient or Higher ENGLISH LANGUAGE ARTS (ELA) 2011: 94%
Proficient or Higher MATH 2011: 83%
Proficient or Higher SCIENCE 2011: 81%
Average Total SAT Score: 1470
2014 performance at a glance
Student to Teacher Ratio (2010–2011): 11.4
4-Year Graduation Rates (2010): 89.1%
Spending per Student (2009–2010, by District): $12,384

Prev
Next
#27 Quaboag Regional High
Warren, MA
2014 Overall MA Rank: #177
Enrollment (2010–2011): 364
Testing
Proficient or Higher ENGLISH LANGUAGE ARTS (ELA) 2011: 92%
Proficient or Higher MATH 2011: 86%
Proficient or Higher SCIENCE 2011: 81%
Average Total SAT Score: 1521
2014 performance at a glance
Student to Teacher Ratio (2010–2011): 11.8
4-Year Graduation Rates (2010): 79.4%
Spending per Student (2009–2010, by District): $12,077

Prev
Next
#26 Southwich-Tolland Regional High
Southwick, MA
2014 Overall MA Rank: #172
Enrollment (2010–2011): 544
Testing
Proficient or Higher ENGLISH LANGUAGE ARTS (ELA) 2011: 94%
Proficient or Higher MATH 2011: 81%
Proficient or Higher SCIENCE 2011: 75%
Average Total SAT Score: 1552
2014 performance at a glance
Student to Teacher Ratio (2010–2011): 12
4-Year Graduation Rates (2010): 88.1%
Spending per Student (2009–2010, by District): $11,547

Prev
Next
#25 Grafton High School
Grafton, MA
2014 Overall MA Rank: #168
Enrollment (2010–2011): 767
Testing
Proficient or Higher ENGLISH LANGUAGE ARTS (ELA) 2011: 93%
Proficient or Higher MATH 2011: 89%
Proficient or Higher SCIENCE 2011: 87%
Average Total SAT Score: 1578
2014 performance at a glance
Student to Teacher Ratio (2010–2011): 13.7
4-Year Graduation Rates (2010): 93.4%
Spending per Student (2009–2010, by District): $10,064

Prev
Next
#24 Sutton High School
Sutton, MA
2014 Overall MA Rank: #164
Enrollment (2010–2011): 418
Testing
Proficient or Higher ENGLISH LANGUAGE ARTS (ELA) 2011: 94%
Proficient or Higher MATH 2011: 91%
Proficient or Higher SCIENCE 2011: 75%
Average Total SAT Score: 1596
2014 performance at a glance
Student to Teacher Ratio (2010–2011): 14.6
4-Year Graduation Rates (2010): 94.1%
Spending per Student (2009–2010, by District): $11,329

Prev
Next
#23 Marlborough High
Marlborough, MA
2014 Overall MA Rank: #162
Enrollment (2010–2011): 1075
Testing
Proficient or Higher ENGLISH LANGUAGE ARTS (ELA) 2011: 89%
Proficient or Higher MATH 2011: 79%
Proficient or Higher SCIENCE 2011: 67%
Average Total SAT Score: 1515
2014 performance at a glance
Student to Teacher Ratio (2010–2011): 10.7
4-Year Graduation Rates (2010): 84.1%
Spending per Student (2009–2010, by District): $14,198

Prev
Next
#22 Hopedale Jr. Sr. High
Hopedale, MA
2014 Overall MA Rank: #161
Enrollment (2010–2011): 344
Testing
Proficient or Higher ENGLISH LANGUAGE ARTS (ELA) 2011: 100%
Proficient or Higher MATH 2011: 94%
Proficient or Higher SCIENCE 2011: 84%
Average Total SAT Score: 1519
2014 performance at a glance
Student to Teacher Ratio (2010–2011): 13.4
4-Year Graduation Rates (2010): 96.6%
Spending per Student (2009–2010, by District): $10,448

Prev
Next
#21 Bay Path Regional Vocation Technical
Charlton, MA
2014 Overall MA Rank: #156
Enrollment (2010–2011): 1104
Testing
Proficient or Higher ENGLISH LANGUAGE ARTS (ELA) 2011: 93%
Proficient or Higher MATH 2011: 82%
Proficient or Higher SCIENCE 2011: 75%
Average Total SAT Score: 1346
2014 performance at a glance
Student to Teacher Ratio (2010–2011): 9.9
4-Year Graduation Rates (2010): 90.5%
Spending per Student (2009–2010, by District): $16,966

Prev
Next
#20 Hudson High
Hudson, MA
2014 Overall MA Rank: #154
Enrollment (2010–2011): 1113
Testing
Proficient or Higher ENGLISH LANGUAGE ARTS (ELA) 2011: 98%
Proficient or Higher MATH 2011: 91%
Proficient or Higher SCIENCE 2011: 73%
Average Total SAT Score: 1475
2014 performance at a glance
Student to Teacher Ratio (2010–2011): 12
4-Year Graduation Rates (2010): 90.2%
Spending per Student (2009–2010, by District): $13,294

Prev
Next
#19 Wachusset Regional High
Holden, MA
2014 Overall MA Rank: #152
Enrollment (2010–2011): 2095
Testing
Proficient or Higher ENGLISH LANGUAGE ARTS (ELA) 2011: 96%
Proficient or Higher MATH 2011: 91%
Proficient or Higher SCIENCE 2011: 83%
Average Total SAT Score: 1617
2014 performance at a glance
Student to Teacher Ratio (2010–2011): 15.1
4-Year Graduation Rates (2010): 93%
Spending per Student (2009–2010, by District): $10,817

Prev
Next
#18 Millbury Junior/Senior High
Millbury, MA
2014 Overall MA Rank: #150
Enrollment (2010–2011): 713
Testing
Proficient or Higher ENGLISH LANGUAGE ARTS (ELA) 2011: 95%
Proficient or Higher MATH 2011: 80%
Proficient or Higher SCIENCE 2011: 68%
Average Total SAT Score: 1517
2014 performance at a glance
Student to Teacher Ratio (2010–2011): 11.2
4-Year Graduation Rates (2010): 89.7%
Spending per Student (2009–2010, by District): $13,444

Prev
Next
#17 Oakmont Regional High School
Ashburnham, MA
2014 Overall MA Rank: #148
Enrollment (2010–2011): 689
Testing
Proficient or Higher ENGLISH LANGUAGE ARTS (ELA) 2011: 99%
Proficient or Higher MATH 2011: 89%
Proficient or Higher SCIENCE 2011: 86%
Average Total SAT Score: 1567
2014 performance at a glance
Student to Teacher Ratio (2010–2011): 15.3
4-Year Graduation Rates (2010): 95.1%
Spending per Student (2009–2010, by District): $12,027

Prev
Next
#16 Ayer Shirley Regional High School
Ayer, MA
2014 Overall MA Rank: #146
Enrollment (2010–2011): 325
Testing
Proficient or Higher ENGLISH LANGUAGE ARTS (ELA) 2011: 95%
Proficient or Higher MATH 2011: 88%
Proficient or Higher SCIENCE 2011: 85%
Average Total SAT Score: 1447
2014 performance at a glance
Student to Teacher Ratio (2010–2011): 10.3
4-Year Graduation Rates (2010): 83.8%
Spending per Student (2009–2010, by District): $13,040

Prev
Next
#15 Auburn Senior High
Auburn, MA
2014 Overall MA Rank: #144
Enrollment (2010–2011): 689
Testing
Proficient or Higher ENGLISH LANGUAGE ARTS (ELA) 2011: 95%
Proficient or Higher MATH 2011: 89%
Proficient or Higher SCIENCE 2011: 84%
Average Total SAT Score: 1489
2014 performance at a glance
Student to Teacher Ratio (2010–2011): 11.8
4-Year Graduation Rates (2010): 94.7%
Spending per Student (2009–2010, by District): $12,211

Prev
Next
#14 Nipmuc Regional High
Upton, MA
2014 Overall MA Rank: #134
Enrollment (2010–2011): 667
Testing
Proficient or Higher ENGLISH LANGUAGE ARTS (ELA) 2011: 95%
Proficient or Higher MATH 2011: 94%
Proficient or Higher SCIENCE 2011: 90%
Average Total SAT Score: 1557
2014 performance at a glance
Student to Teacher Ratio (2010–2011): 13.8
4-Year Graduation Rates (2010): 96.8%
Spending per Student (2009–2010, by District): $11,242

Prev
Next
#13 Shrewsbury Sr. High
Shrewsbury, MA
2014 Overall MA Rank: #117
Enrollment (2010–2011): 1647
Testing
Proficient or Higher ENGLISH LANGUAGE ARTS (ELA) 2011: 98%
Proficient or Higher MATH 2011: 94%
Proficient or Higher SCIENCE 2011: 90%
Average Total SAT Score: 1677
2014 performance at a glance
Student to Teacher Ratio (2010–2011): 16.9
4-Year Graduation Rates (2010): 94.7%
Spending per Student (2009–2010, by District): $11,318

Prev
Next
#12 Lunenburg High
Lunenburg, MA
2014 Overall MA Rank: #104
Enrollment (2010–2011): 577
Testing
Proficient or Higher ENGLISH LANGUAGE ARTS (ELA) 2011: 97%
Proficient or Higher MATH 2011: 96%
Proficient or Higher SCIENCE 2011: 97%
Average Total SAT Score: 1546
2014 performance at a glance
Student to Teacher Ratio (2010–2011): 13
4-Year Graduation Rates (2010): 96.8%
Spending per Student (2009–2010, by District): $11,448

Prev
Next
#11 Blackstone Valley Reg. Vocational
Upton, MA
2014 Overall MA Rank: #85
Enrollment (2010–2011): 1164
Testing
Proficient or Higher ENGLISH LANGUAGE ARTS (ELA) 2011: 99%
Proficient or Higher MATH 2011: 95%
Proficient or Higher SCIENCE 2011: 91%
Average Total SAT Score: 1434
2014 performance at a glance
Student to Teacher Ratio (2010–2011): 13.2
4-Year Graduation Rates (2010): 97.8%
Spending per Student (2009–2010, by District): $17,131

Prev
Next
#10 Tahanto Regional High
Boylston), MA
2014 Overall MA Rank: #80
Enrollment (2010–2011): 282
Testing
Proficient or Higher ENGLISH LANGUAGE ARTS (ELA) 2011: 95%
Proficient or Higher MATH 2011: 89%
Proficient or Higher SCIENCE 2011: 94%
Average Total SAT Score: 1613
2014 performance at a glance
Student to Teacher Ratio (2010–2011): 12.7
4-Year Graduation Rates (2010): 86.9%
Spending per Student (2009–2010, by District): $13,409

Prev
Next
#9 Nashoba Regional
Bolton, MA
2014 Overall MA Rank: #76
Enrollment (2010–2011): 1033
Testing
Proficient or Higher ENGLISH LANGUAGE ARTS (ELA) 2011: 95%
Proficient or Higher MATH 2011: 92%
Proficient or Higher SCIENCE 2011: 87%
Average Total SAT Score: 1680
2014 performance at a glance
Student to Teacher Ratio (2010–2011): 14.6
4-Year Graduation Rates (2010): 95.1%
Spending per Student (2009–2010, by District): $12,686
Prev
Next
#8 Leominster High School & Ctr for Tech
Leominster, MA
2014 Overall MA Rank: #64
Enrollment (2010–2011): 34
Testing
Proficient or Higher ENGLISH LANGUAGE ARTS (ELA) 2011: 85%
Proficient or Higher MATH 2011: 82%
Proficient or Higher SCIENCE 2011: 75%
Average Total SAT Score: 1416
2014 performance at a glance
Student to Teacher Ratio (2010–2011):
4-Year Graduation Rates (2010): 92.6%
Spending per Student (2009–2010, by District): $12,233
Prev
Next
#7 Tantasqua Regional Sr. High
Fiskdale, MA
2014 Overall MA Rank: #63
Enrollment (2010–2011): 756
Testing
Proficient or Higher ENGLISH LANGUAGE ARTS (ELA) 2011: 97%
Proficient or Higher MATH 2011: 86%
Proficient or Higher SCIENCE 2011: 75%
Average Total SAT Score: 1607
2014 performance at a glance
Student to Teacher Ratio (2010–2011): 9.7
4-Year Graduation Rates (2010): 94.9%
Spending per Student (2009–2010, by District): $12,985

Prev
Next
#6 Groton Dunstable Regional
Groton, MA
2014 Overall MA Rank: #62
Enrollment (2010–2011): 870
Testing
Proficient or Higher ENGLISH LANGUAGE ARTS (ELA) 2011: 99%
Proficient or Higher MATH 2011: 98%
Proficient or Higher SCIENCE 2011: 95%
Average Total SAT Score: 1664
2014 performance at a glance
Student to Teacher Ratio (2010–2011): 14.6
4-Year Graduation Rates (2010): 97%
Spending per Student (2009–2010, by District): $12,261

Prev
Next
#5 Hopkinton High
Hopkinton, MA
2014 Overall MA Rank: #53
Enrollment (2010–2011): 1150
Testing
Proficient or Higher ENGLISH LANGUAGE ARTS (ELA) 2011: 98%
Proficient or Higher MATH 2011: 95%
Proficient or Higher SCIENCE 2011: 93%
Average Total SAT Score: 1688
2014 performance at a glance
Student to Teacher Ratio (2010–2011): 14.5
4-Year Graduation Rates (2010): 99.2%
Spending per Student (2009–2010, by District): $12,472

Prev
Next
#4 Algonquin Regional High
Northborough, MA
2014 Overall MA Rank: #33
Enrollment (2010–2011): 1471
Testing
Proficient or Higher ENGLISH LANGUAGE ARTS (ELA) 2011: 99%
Proficient or Higher MATH 2011: 95%
Proficient or Higher SCIENCE 2011: 96%
Average Total SAT Score: 1715
2014 performance at a glance
Student to Teacher Ratio (2010–2011): 14.3
4-Year Graduation Rates (2010): 97.5%
Spending per Student (2009–2010, by District): $13,900
Prev
Next
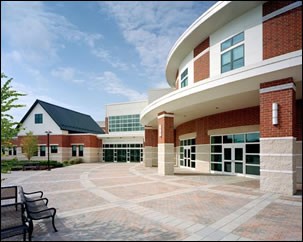
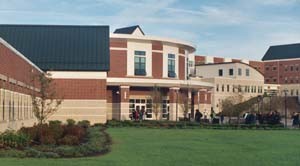
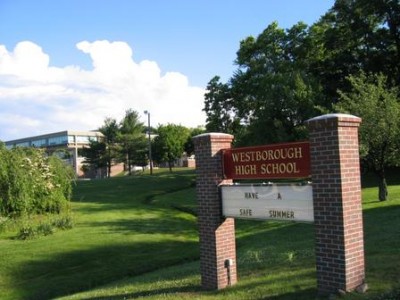
#3 Westborough High
Westborough, MA
2014 Overall MA Rank: #26
Enrollment (2010–2011): 1053
Testing
Proficient or Higher ENGLISH LANGUAGE ARTS (ELA) 2011: 97%
Proficient or Higher MATH 2011: 93%
Proficient or Higher SCIENCE 2011: 95%
Average Total SAT Score: 1716
2014 performance at a glance
Student to Teacher Ratio (2010–2011): 12.6
4-Year Graduation Rates (2010): 96.6%
Spending per Student (2009–2010, by District): $14,545
Prev
Next
#2 Bromfield
Harvard, MA
2014 Overall MA Rank: #13
Enrollment (2010–2011): 709
Testing
Proficient or Higher ENGLISH LANGUAGE ARTS (ELA) 2011: 100%
Proficient or Higher MATH 2011: 97%
Proficient or Higher SCIENCE 2011: 97%
Average Total SAT Score: 1824
2014 performance at a glance
Student to Teacher Ratio (2010–2011): 13.8
4-Year Graduation Rates (2010): 98.3%
Spending per Student (2009–2010, by District): $13,984

Prev
Next
#1 Advanced Math and Science Academy
Marlborough, MA
2014 Overall MA Rank: #6
Enrollment (2010–2011): 567
Testing
Proficient or Higher ENGLISH LANGUAGE ARTS (ELA) 2011: 100%
Proficient or Higher MATH 2011: 100%
Proficient or Higher SCIENCE 2011: 98%
Average Total SAT Score: 1825
2014 performance at a glance
Student to Teacher Ratio (2010–2011): 11.5
4-Year Graduation Rates (2010): 98.6%
Spending per Student (2009–2010, by District): $14,198
Related Articles
Enjoy this post? Share it with others.
Email to a friend
Permalink


 Delivered Free Every
Follow us on Pinterest Google + Facebook Twitter See It Read It