Are Massachusetts Drivers Terrible? - See the National Ranking


Monday, November 30, 2015

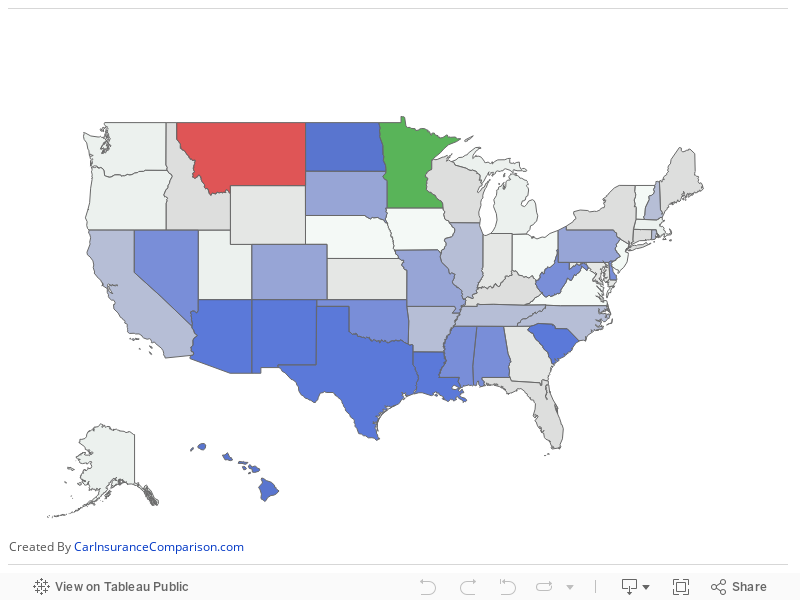
Overall, Massachusetts ranks 41st in the United States and looking inside the numbers and the trends is disturbing. The study uses data and ranks the states by how bad their drivers score. The 1st ranked state is the worst drivers and 50th is the best driving state.
In Worcester, there have been a series of hit-and-runs including a police officer hit in the past few weeks. One of the most infamous hit-and-runs was the case of a Sarah Ewing, a 24-year-old woman that was killed in Kelley Square when she was pinned down by the rear wheels of a tractor trailer in May. She was from Hudson.
SEE BELOW SLIDES AS TO HOW EACH NEW ENGLAND STATE RANKED
Ewing was freed from the wheels of the truck and transported to a hospital. She was in critical condition at the scene of the accident and was pronounced dead at the hospital.
According to a Worcester Police Department, "the preliminary investigation indicates that the tractor trailer was traveling east on Millbury Street approaching Kelley Square. Apparently the truck had pulled to the right side of the road to let a Worcester fire truck pass by. After the firetruck passed the tractor trailer entered Kelley Square and attempted to turn right. The tractor trailer was attempting to head in the direction of the onramps to Route 290. At this time the truck cut the turn too close to the side of the road. As a result the trailer portion hit a light pole. The impact caused the light pole to fall. Standing near the light pole was the female victim and a male victim. As the pole fell it forced the two towards the truck as it was in the process of turning. The female was run over by the rear two wheels of the trailer. She was pinned in-between the two wheels until fire rescue freed her.

• Fatalities Rate per 100 Million Vehicle Miles Traveled
• Failure to Obey (Percentage of Fatal Crashes that involved Traffic Signals, Not Wearing Seat Belts, and Driving with an Invalid Driver’s License)
• Drunk Driving (Percentage of Fatal Crashes that Involved Alcohol)
• Speeding (Percentage of Driving Fatalities that were Speed-Related)
• Careless Driving (Pedestrian & Bicyclist Fatalities per 100,000 Population)
SEE THE INTERACTIVE MAP
Related Slideshow: See the Ranking of New England Drivers - 2015
See how each of the New England states rank for worst drivers - remember the lower the rank, the worse the drivers.


Related Articles
- Leonardo Angiulo: When a Car Accident Isn’t Just an Accident
- Truck Driver in Fatal Kelley Square Accident Cited for Vehicular Homicide
- 24-Year-Old Woman Killed in Tragic Accident at Kelley Square Identified
- Webster Man Kills Two in Drunk Driving Accident in Rhode Island
- Charges Pending Against Driver Involved in Multiple Hit-and-Run Accidents
- Mass State Police Investigating Patriots’ Brandon Spikes for Hit and Run
- Driving, Teens & Crashes
- NEW: 21-Year-Old Worcester Woman Involved in Fatal Car Crash in East Brookfield
- Man Arrested in Worcester on OUI Drug Charges After Crashing Into NStar Truck
- NEW: Plane Crashes After Takeoff from Worcester Airport, Pilot Killed
- Mass State Police Seeking Drivers Responsible for Fatal I-395 Crash
- NEW: Worcester Woman Killed in Hit and Run on Lincoln Street Saturday Night
- MA State Police Chosen for Crash Investigation Commission
- Victim of Plane Crash Identified as Gary Weller of Connecticut
- Plane Crash Drill to Be Held at Worcester Airport on Tuesday
- Beltless School Bus Driver Falls Out of Seat, Crashes Into 2 Cars in Worcester
- NEW: Second Victim in Lincoln Street Hit and Run Dies
- NEW: Worcester Police Officer Injured in Hit and Run
- State Police Identify Man Killed in East Brookfield Crash
- Three Vehicle Crash on I-290 Results in Worcester Woman Life Flighted to UMass
- 35-Year-Old Worcester Man Suffers Serious Injuries After Crash in Plymouth
- UPDATED: Oxford Crash Results in Death of Sturbridge Woman
- VIDEO: 4-Wheeler Crashes Into Car in Worcester and Then Drives Off
- RIGHT NOW: Major Crash on Mass Pike Results in Fatality
- Names Released in Fatal Mass Pike Crash


 Delivered Free Every
Follow us on Pinterest Google + Facebook Twitter See It Read It